Chapter 11. Using Paths
path elements are SVG’s answer to drawing irregular forms. Anything that’s not a rect, circle, or another simple shape can be drawn as a path. The catch is that the syntax for defining path values is not particularly human-friendly. For example, here is a line that we’ll generate from data in this chapter. Note the path syntax, as specified in the element’s d attribute and shown in Figure 11-1.
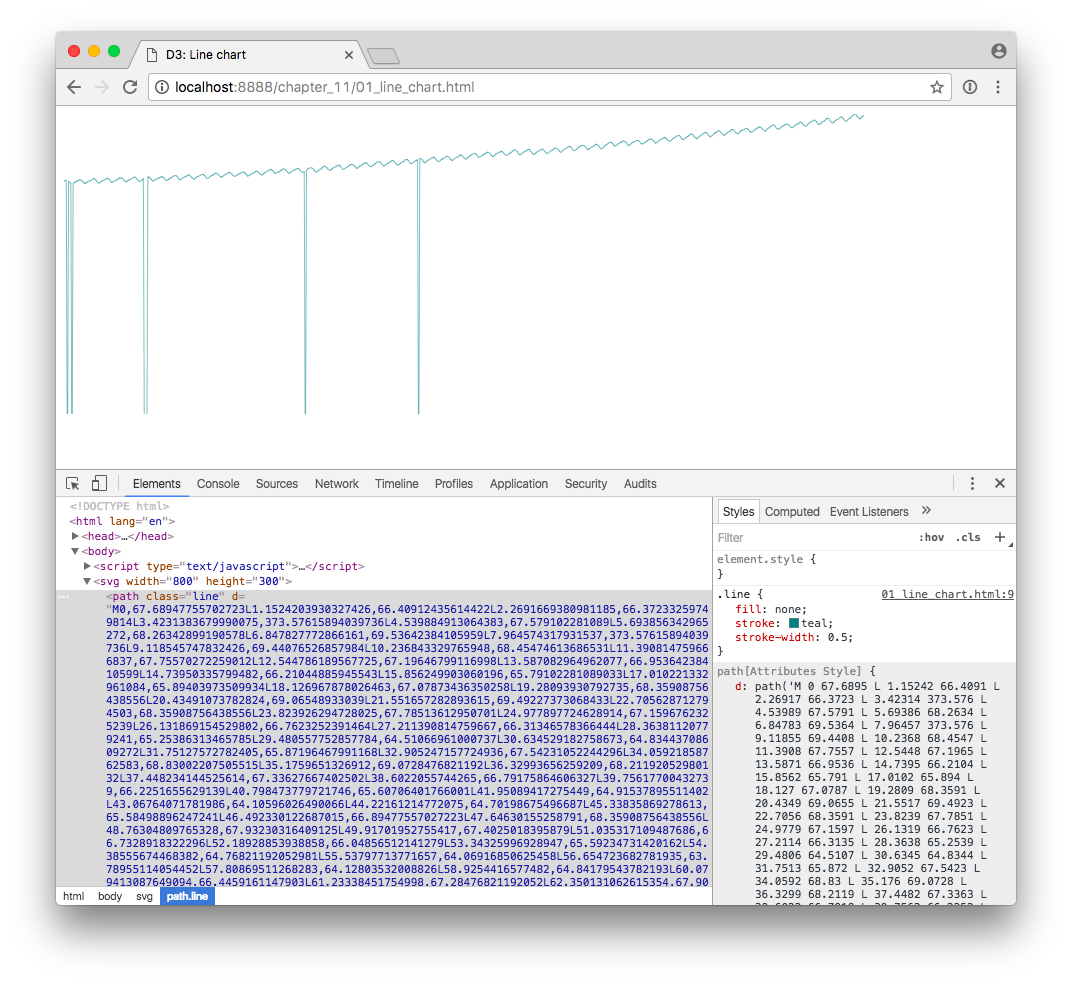
Figure 11-1. A path and its d attribute
If you can read that, then you don’t need this book.
Fortunately, D3 has lots of built-in functions that generate paths for you. You’ve already met the axis functions, which express scales as path, line, and text elements. In later chapters, you’ll learn about d3.arc() and d3.geoPath(), both of which also generate paths for different purposes. In this chapter, we’ll cover two other common uses of paths: drawing line and area charts.
Line Charts
Let’s start with a simple line chart. Actually generating the line is quite simple, but we need some data in place first. For this chapter, I’m going to use a real-world dataset.
Data Preparation
Line charts are great for time series, so I’ve decided to chart carbon dioxide measurements over time. I’ve downloaded the “Mauna Loa CO2 monthly mean data”, as provided by the National Oceanic & Atmospheric Administration’s Earth System Research Laboratory. (See the README.md in this chapter’s ...
Get Interactive Data Visualization for the Web, 2nd Edition now with the O’Reilly learning platform.
O’Reilly members experience books, live events, courses curated by job role, and more from O’Reilly and nearly 200 top publishers.

