Chapter 9. Updates, Transitions, and Motion
Until this point, we have used only static datasets. But real-world data almost always changes over time. And you might want your visualization to reflect those changes.
In D3 terms, those changes are handled by updates. The visual adjustments are made pretty with transitions, which can employ motion for perceptual benefit.
We’ll start by generating a visualization with one dataset, and then changing the data completely.
Modernizing the Bar Chart
Let’s revisit our trusty old bar chart in Figure 9-1.
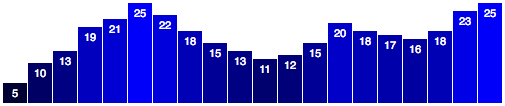
Figure 9-1. The bar chart, as seen last
If you examine the code in 01_bar_chart.html, you’ll see that we used this static dataset:
vardataset=[5,10,13,19,21,25,22,18,15,13,11,12,15,20,18,17,16,18,23,25];
Since then, we’ve learned how to write more flexible code, so our chart elements resize to accommodate different-sized datasets (meaning shorter or longer arrays) and different data values (smaller or larger numbers). We accomplished that flexibility using D3 scales, so I’d like to start by bringing our bar chart up to speed.
Ready? Okay, just give me a sec…
Aaaaaand, done! Thanks for waiting.
Figure 9-2 looks pretty similar, but a lot has changed under the hood. You can follow along by opening 02_bar_chart_with_scales.html.
Figure 9-2. A scalable, flexible bar chart
To start, I adjusted the width and height, ...
Get Interactive Data Visualization for the Web, 2nd Edition now with the O’Reilly learning platform.
O’Reilly members experience books, live events, courses curated by job role, and more from O’Reilly and nearly 200 top publishers.

