Chapter 10. Interactivity
Now that you’re an old pro at data updates, transitions, and motion, let’s incorporate true interactivity.
Binding Event Listeners
Say what? I know, I know: First, we bound data, which was weird enough. And now I’m talking about binding event listeners? (This is how JavaScript earned its reputation for being such a strange language.)
As explained in Chapter 9, JavaScript uses an event model in which “events” are triggered by things happening, such as new input from the user, provided via a keyboard, mouse, or touch screen. Most of the time, events are being triggered constantly, left and right—it’s just that nobody is listening for them, so they are ignored.
To make our pieces interactive, we define chunks of code that listen for specific events being triggered on specific DOM elements. In Chapter 9, we used the following code:
d3.select("p").on("click",function(){//Do something on click});
This binds an event listener to the p paragraph element. The listener happens to be listening for the click event, which is the JavaScript event triggered when the user clicks the mouse on that p element. (D3 doesn’t use custom event names, although you can define your own. For the sake of supporting existing standards, D3 recognizes all the standard JavaScript events, such as mouseover and click. The events supported vary somewhat by browser. Peter-Paul Koch’s event compatibility tables are a useful reference.)
This gets at one of the nuances of JavaScript’s event model, which is that events don’t happen in a vacuum. Rather, they are always called on a specific element. So the code just shown isn’t activated whenever any click occurs; it is run just when a click occurs on the p element.
You could achieve all this with raw JavaScript, but D3’s on() method is a handy way to quickly bind event listeners to D3 selections. As you can see, on() takes two arguments: the event name, and an anonymous function to be executed when the event is triggered on the selected element.
Making your visualization interactive is a simple, two-step process that includes:
- Binding event listeners
- Defining the behavior
Introducing Behaviors
Let’s start by working with an earlier, static version of our bar chart. See sample code 01_start.html.
The example code binds an event on only one element: p. This is an unusual usage for on(). More commonly, you will want to bind event listeners to more than one element at a time, such as to all of the visual elements in your visualization. Fortunately, that is very easy to do. Instead of using select() to select only one element, use selectAll() to select multiple elements and pass that selection to on().
You can even bind those event listeners right at the moment when you first create elements. For example, here is our existing code that creates our bar chart’s rects, to which I’ve simply tacked on on():
//Create barssvg.selectAll("rect").data(dataset).enter().append("rect")…//Set attributes (omitted here).on("click",function(d){//This will run whenever *any* bar is clicked});
When defining the anonymous function, you can reference d, or d and i, or neither, just as you’ve seen throughout D3. And then whatever code you put between the function’s brackets will execute on click.
This is a quick and easy way to verify your data values, for example:
.on("click",function(d){console.log(d);});
Try that code by running 02_click.html, open the JavaScript console, and click on some bars. When you click on each bar, you should see that bar’s data value printed to the console. Nice!
Hover to Highlight
Highlighting elements in response to mouse interaction is a common way to make your visualization feel more responsive, and it can help users navigate and focus on the data of interest.
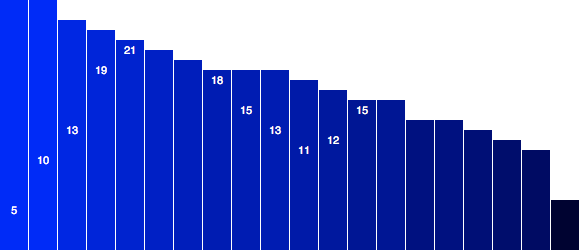
A simple hover effect can be achieved with CSS alone—no JavaScript required! The CSS pseudoclass selector :hover can be used in combination with any other selector to select, well, that same thing, but when the mouse is hovering over the element. Here, we select all SVG rects and set their fill to orange (see Figure 10-1):
rect:hover{fill:orange;}
See 03_hover.html, and try it out yourself.
CSS hover styling is fast and easy, but limited. There’s only so much you can achieve with :hover. Fortunately, recent browsers support applying the new CSS3 transitions on SVG elements. Try adding this above the rect:hover rule in that example:
rect{-moz-transition:all0.3s;-o-transition:all0.3s;-webkit-transition:all0.3s;transition:all0.3s;}
This tells browsers (including Mozilla, Opera, and Webkit-based browsers) to apply a 0.2-second transition to any changes to the rect elements. Run that, and you’ll see that the blue/orange switch no longer happens instantly, but smoothly, over a brief 0.2-second period. Nice!
Yet these transitions can also be managed using JavaScript and D3, for additional control and coordination with other parts of our visualization. Luckily for us, D3 handles all the hassle of transitions for us, so working with JavaScript is not so bad. Let’s re-create the orange hover effect without CSS.
Instead of referencing the click event, as we did earlier, we can call on() with mouseover, the JavaScript event equivalent of CSS’s hover:
.on("mouseover",function(){//Do something on mouseover of any bar});
Now we want to set the fill of this bar (the one on which the mouseover event is triggered) to orange. Yet we are operating in the context of an anonymous function—how could we possibly select the same element on which the event was just triggered?
The answer is this. No, sorry, I mean this. Just select this, and set its fill to orange:
.on("mouseover",function(){d3.select(this).attr("fill","orange");});
Another reason “real” programmers hate JavaScript is because of its notoriously wishy washy use of the keyword this. In other languages, the meaning of this is very clearly defined; not so in JavaScript. (jQuery fans are used to this debate.)
For our purposes, here is all you need to know:
- Context is important.
-
Within anonymous functions, D3 automatically sets the context of
thisso it references “the current element upon which we are acting.”
The end result is that, when we hand off anonymous functions to any of D3’s methods, we can reference this when trying to act on the current element.
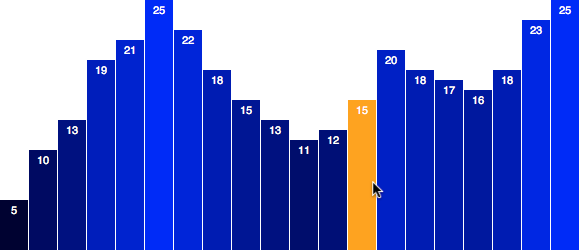
Indeed, you can see this (ha!) in action in 04_mouseover.html (Figure 10-2).

Move the mouse over a rect, the event listener for that rect is triggered, that same rect is selected (as this), and then its fill is set to orange.
Figure 10-2 looks good, but we should probably restore each bar’s original color once the hover is over, meaning on mouseout:
.on("mouseout",function(d){d3.select(this).attr("fill","rgb(0, 0, "+(d*10)+")");});
Perfect! Try it yourself in 05_mouseout.html. See Figure 10-3.
I am really excited to have accomplished in eight lines of JavaScript what I did originally with CSS in only three! (Not!)
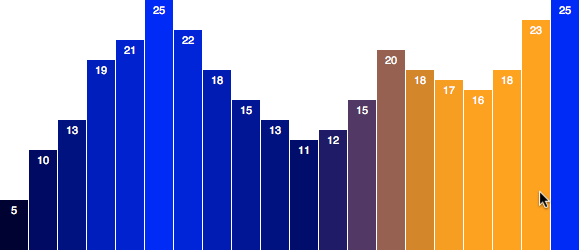
Actually, what I am excited about is to now make the outbound transition silky smooth (see Figure 10-4). As you remember from Chapter 9, accomplishing that involves adding only two lines of code, for transition() and duration():
.on("mouseout",function(d){d3.select(this).transition().duration(250).attr("fill","rgb(0, 0, "+(d*10)+")");});
Try that out in 06_smoother.html.
Grouping SVG Elements
Note that g group elements do not, by themselves, trigger any mouse events. The reason for this is that g elements have no pixels! Only their enclosed elements—like rects, circles, and text elements—have pixels.
You can still bind event listeners to g elements. Just keep in mind that the elements within that g will then behave as a group. For example, if any of the enclosed elements are clicked or moused over, then the listener function will be activated.
This technique can be quite useful when you have several visual elements that should all act in concert. In our bar chart, for example, we could group rect and text elements each into their own groups. The element hierarchy currently looks like this:
svg
        rect
        rect
        rect
        …
        text
        text
        text
        …
After grouping elements, it could look like this:
svg
        g
                rect
                text
        g
                rect
                text
        …
Instead of worrying about pointer-events and which element is on top, we just bind the event listener to the whole group. So clicking on some text will trigger the same code as clicking on a rect because they’re both in the same group.
Even better, throw an invisible rect with a fill of none and pointer-events value of all on the top of each group. Even though the rect is invisible, it will still trigger mouse events, so you could have the rect span the whole height of the chart. The net effect is that mousing anywhere in that column—even in “empty” whitespace above a short blue bar—would trigger the highlight effect.
Click to Sort
Interactive visualization is most powerful when it can provide different views of the data, empowering the user to explore the information from different angles.
The ability to sort data is extremely important. And yes, as you just guessed, D3 makes it very easy to sort elements.
Continuing with the bar chart, let’s add an event listener for the click event, to which we bind an anonymous function that, in turn, will call a new function of our own creation, sortBars().
….on("click",function(){sortBars();});
For simplicity, we are binding this to every bar, but of course you could bind this instead to a button or any other element, inside or outside of the SVG image.
At the end of the code, let’s define this new function and store it in sortBars:
varsortBars=function(){svg.selectAll("rect").sort(function(a,b){returnd3.ascending(a,b);}).transition().duration(1000).attr("x",function(d,i){returnxScale(i);});};
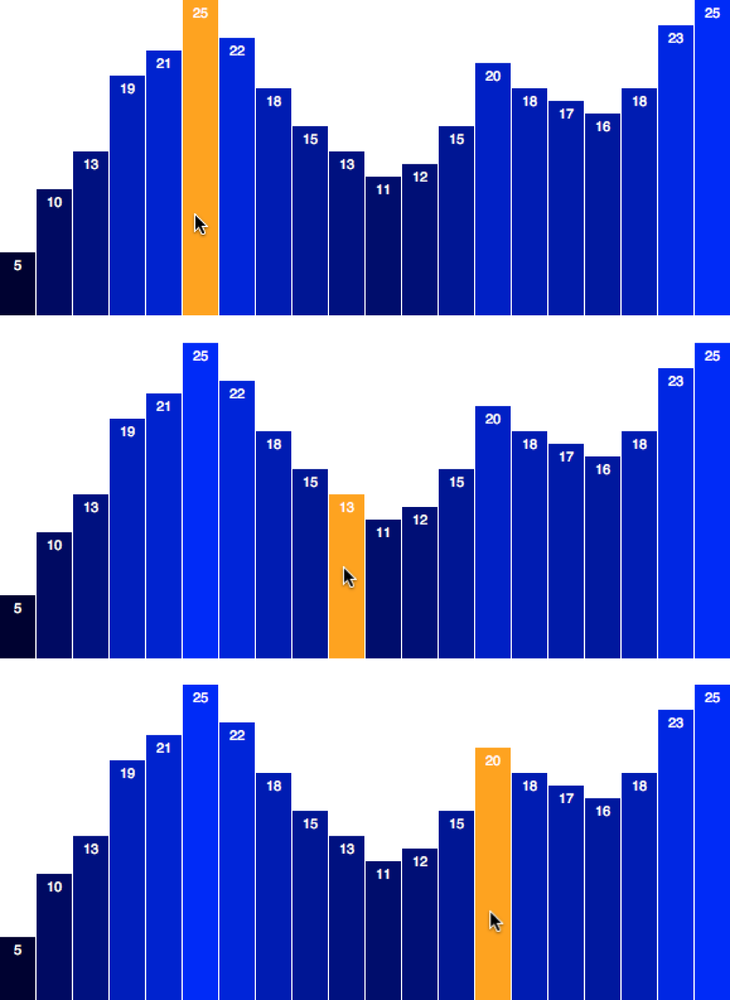
You can see this code in 07_sort.html and the result in Figure 10-5. Try clicking any of the bars, and watch them reorganize.

When sortBars() is called, first we reselect all the rects. Then we use D3’s handy sort() method, which reorders elements based on their bound data values. sort() needs to know how to decide which elements come first, and which later, so we pass into it a comparator function.
Unlike our anonymous functions so far, the comparator doesn’t take d (the current datum) or i (the current index). Instead, it is passed two values, a and b, which represent the data values of two different elements. (You could name them anything else; a and b are just the convention.) The comparator will be called on every pair of elements in our array, comparing a to b, until, in the end, all the array elements are sorted per whatever rules we specify.
We specify how a and b should be compared within the comparator. Thankfully, D3 also provides a handful of comparison functions that spare us from writing more JavaScript. Here, we use d3.ascending(), into which both a and b are passed. Whichever one is bigger comes out the winner. And sort() loops through all the data values in this way until it has all the elements, er, sorted out. (Note that d3.ascending works well in this case, because our values are numbers. Comparing strings of text is a whole other can of worms.)
Finally, our new order in place, we initiate a transition, set a duration of one second, and then calculate the new x position for each rect. (This attr code is just copied from when we created the rects initially.)
This works swimmingly, except for two catches.
First, you’ll notice that we haven’t accounted for the value labels yet, so they didn’t slide into place along with the bars. (I leave that to you as an exercise.)
Second, you might observe that if you mouse over some bars while the transition is occurring, those bars don’t fall properly into place (see Figure 10-6).
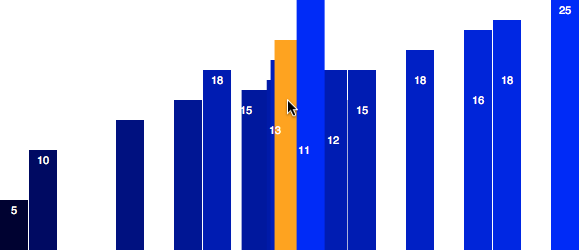
Yeeesh, that doesn’t look good.
Remember from Chapter 9 that newer transitions interrupt and override older transitions. Clicking the bars initiates one transition. Immediately mousing over a bar interrupts that initial transition in order to run the mouseover highlight transition we specified earlier. The end result is that those moused-over bars never make it to their final destinations.
But don’t worry. This example is just a good argument for keeping hover effects in CSS, while letting D3 and JavaScript manage the more visually intensive actions.
In 08_sort_hover.html, I’ve restored the CSS-only highlight and removed the mouseover and mouseout event listeners, so this transition conflict no longer occurs. (The only downside is we no longer have those smooth orange-to-blue fades.)
So far, this sort only goes one direction. Let’s revise this so a second click triggers a re-sort, placing the bars in descending order.
To remember the current state of the chart, we’ll need a Boolean variable:
varsortOrder=false;
Then, in the sortBars() function, we should flip the value of sortOrder, so if it starts out true, it is changed to false, and vice versa:
varsortBars=function(){//Flip value of sortOrdersortOrder=!sortOrder;…
Down in the comparator function, we can add a bit of logic to say if sortOrder is true, then go ahead and sort the bars in ascending order. Otherwise, use descending order:
svg.selectAll("rect").sort(function(a,b){if(sortOrder){returnd3.ascending(a,b);}else{returnd3.descending(a,b);}})…
Give that a shot in 09_resort.html. Now each time you click, the sort order reverses, as shown in Figure 10-7.
One more thing would make this really nice: a per-element delay. (Remember that whole “object constancy” thing?)
As you know, to do that, we just add a simple delay() statement after transition():
….transition().delay(function(d,i){returni*50;}).duration(1000)…
Now take a look at 10_delay.html, in which you can easily follow individual bars with your eyes as they move left and right during each sort.
Tooltips
In interactive visualizations, tooltips are small overlays that present data values. In many cases, it’s not necessary to label every individual data value in the default view, but that level of detail should still be accessible to users. That’s where tooltips come in.
In this section, I present three different methods to constructing tooltips with D3, ranging from the simplest to the most complex.
Default Browser Tooltips
These should be your first stop. A quick-and-dirty, functional but not pretty option, default browser tooltips are usually those ugly yellow boxes you see floating over content when you hold your mouse still for too long. These are very easy to make, and the browser manages the placements for you, but you have zero control over how they look—that’s also set by the browser.
Figure 10-8 shows our bar chart, with value labels removed, and default browser tooltips implemented. The tooltips show up after hovering the mouse over any bar for a few seconds.
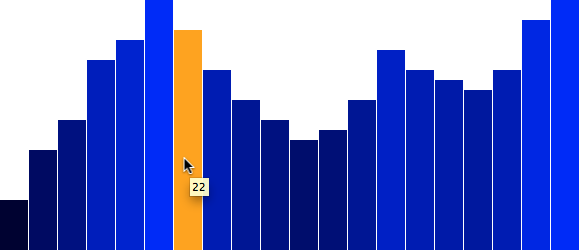
See 11_browser_tooltip.html for the code and a demo. To make these tooltips, simply inject a title element into whatever element should have the tooltip applied. For example, after we create all those rects:
svg.selectAll("rect").data(dataset).enter().append("rect")…
we can just tack on to the end of that chain:
.append("title").text(function(d){returnd;});
append() creates the new title element, and then text() sets its content to d, the bound value.
We could make this text a little less spare by prefixing it with something (see Figure 10-9):
.append("title").text(function(d){return"This value is "+d;});
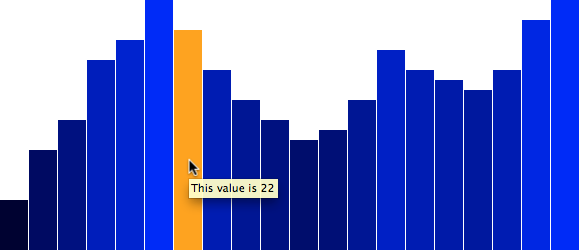
See 12_browser_tooltip_text.html for that code.
SVG Element Tooltips
For more visual control over your tooltips, code them as SVG elements.
As usual, there are many different approaches you could take. I’ll suggest adding event listeners, so on each mouseover, a new value label is created, and on mouseout it is destroyed. (Another idea would be to pregenerate all the labels, but then just show or hide them based on mouse hover status. Or just stick with one label, but show or hide it and change its position as needed.)
Back to the bars we go. We’ll add back in a mouseover event listener, in which we first get the x and y values for the current element (this, remember?). We’ll need this information to know where to place the new tooltip, so it appears nicely “on top of” the bar that’s triggering the rollover.
When we retrieve those values, we wrap them in parseFloat(), which is a JavaScript function for “Hey, even if this information is a string of text, please convert it to a floating point number for me.”
Lastly, I’m adding a bit to both the x and y values, to center the new tooltips near the top of any given bar:
.on("mouseover",function(d){//Get this bar's x/y values, then augment for the tooltipvarxPosition=parseFloat(d3.select(this).attr("x"))+xScale.rangeBand()/2;varyPosition=parseFloat(d3.select(this).attr("y"))+14;
That’s the hard part. Now all we do is create the tooltip as a simple text element, in this case, but of course you could add a background rect or do anything else here for visual effect:
//Create the tooltip labelsvg.append("text").attr("id","tooltip").attr("x",xPosition).attr("y",yPosition).attr("text-anchor","middle").attr("font-family","sans-serif").attr("font-size","11px").attr("font-weight","bold").attr("fill","black").text(d);})
Yes, this is based on our earlier value label code, simply adapted slightly. Note that the x and y attributes are set to the new position values we just calculated, and the actual text content of the label is set to d, the datum passed into the event listener function.
Also note that I assigned this next text element an ID of tooltip. This is so we can easily select (and delete!) the element when we’re done with it—on mouseout:
.on("mouseout",function(){//Remove the tooltipd3.select("#tooltip").remove();})
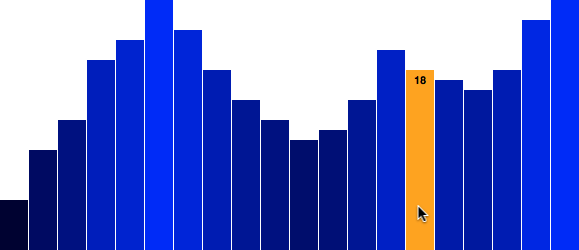
Test out the code in 13_svg_tooltip.html.
As you can see in Figure 10-10, you have much more visual control when using SVG elements as tooltips, but they are a little more time-consuming to set up. And of course, you can get much fancier than this simple example.
HTML div Tooltips
A similar approach can be used with HTML div elements as tooltips. You might consider using a div when:
See Figures 10-11 and 10-12 for examples.
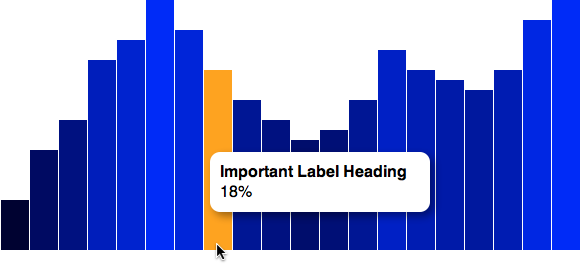
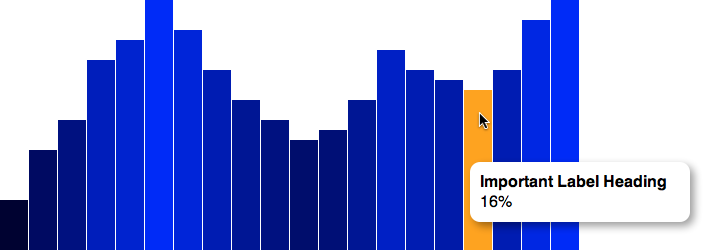
Again, there are many ways to do this, but I like to make a hidden div in my HTML that gets populated with the data value, and is then unhidden when triggered. You can follow along with the final code in 14_div_tooltip.html.
The div itself could be created dynamically with D3, but I like to just type it in by hand:
<divid="tooltip"class="hidden"><p><strong>Important Label Heading</strong></p><p><spanid="value">100</span>%</p></div>
Now it’s going to need some special CSS styling rules:
#tooltip{position:absolute;width:200px;height:auto;padding:10px;background-color:white;-webkit-border-radius:10px;-moz-border-radius:10px;border-radius:10px;-webkit-box-shadow:4px4px10pxrgba(0,0,0,0.4);-moz-box-shadow:4px4px10pxrgba(0,0,0,0.4);box-shadow:4px4px10pxrgba(0,0,0,0.4);pointer-events:none;}#tooltip.hidden{display:none;}#tooltipp{margin:0;font-family:sans-serif;font-size:16px;line-height:20px;}
Note in particular that its position is absolute, so we can control exactly where it should appear on the page. I’ve also added some fancy rounded corners and a drop shadow. Plus, pointer-events: none ensures that mousing over the tooltip itself won’t trigger a mouseout event on the bars, thereby hiding the tooltip. (Try the code without this line, and you’ll see what I mean.) Lastly, when the tooltip is given a class of hidden, it is not displayed.
I made some modifications to the mouseover function, so the div is roughly centered vertically against its triggering bar. The revised code now also sets the tooltip’s left and top position per CSS layout requirements, sets the text content of the #value span to d, and then—now that everything is in place—removes the hidden class, making the tooltip visible:
.on("mouseover",function(d){//Get this bar's x/y values, then augment for the tooltipvarxPosition=parseFloat(d3.select(this).attr("x"))+xScale.rangeBand()/2;varyPosition=parseFloat(d3.select(this).attr("y"))/2+h/2;//Update the tooltip position and valued3.select("#tooltip").style("left",xPosition+"px").style("top",yPosition+"px").select("#value").text(d);//Show the tooltipd3.select("#tooltip").classed("hidden",false);})
Hiding the tooltip on mouseout is much easier; simply add on the hidden class:
.on("mouseout",function(){//Hide the tooltipd3.select("#tooltip").classed("hidden",true);})
Warning
The layout of this simple example works well, but in a real-world situation, the D3 chart would be just one of many other elements on the page. As you probably know, perfecting HTML/CSS layouts can be a challenge, and this is the biggest hassle of getting HTML elements to interact properly with an SVG chart. It can help to put both the tooltip div and SVG chart within the same enclosing element (like a container div), so then you only have to worry about relative positions. d3.mouse can be used to get mouse coordinates relative to any other element on the page, and can be useful in cases when you need to position non-SVG elements in relationship to the mouse.
Consideration for Touch Devices
The browsers on most popular touch devices—such as iOS and Android devices—automatically translate touch events into mouse events, for JavaScript purposes. So a tap on an element is interpreted by the browser as a click event. This means that, for the most part, your code that was crafted for mouse interfaces will also work just fine for touch-based interfaces.
The primary exception to this is multitouch, which is not automagically handled by D3. There’s no easy answer on how to handle multitouch interactions yet, but D3 does track the touches for you (although it’s up to you to decide how to use them). See the API reference for d3.touches.
Moving Forward
Congratulations! You now have all the basics of D3 under your cap. You are a pro at binding data, generating and styling elements based on that data, implementing scales and drawing axes, and modifying your creations with new data, animated transitions, and interactivity. What more could you ask for?
How about layouts and geomaps? The next two chapters will dive into these more advanced topics, but—be warned—without the same level of detail as the prior chapters. Now that you know the basics, you don’t need every little thing spelled out. Here we go!
Get Interactive Data Visualization for the Web now with the O’Reilly learning platform.
O’Reilly members experience books, live events, courses curated by job role, and more from O’Reilly and nearly 200 top publishers.

