Starting the debugger
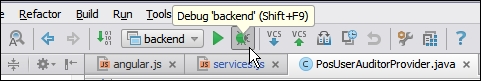
To begin the debugging session, you will need the runtime/debug configuration defined for the project. We described this process in detail in Chapter 5, Make It Happen – Running Your Project. This time, though, instead of running the defined configuration, use the Shift + F9 (PC) or Ctrl + D (Mac) keyboard shortcut; or click on the Debug icon on the toolbar, as shown here:
When you start the debug configuration, two things will happen. First, IntelliJ IDEA will analyze the breakpoints you set up and, if they are valid, will mark them with the valid breakpoint icon, as shown here:
Otherwise, if the breakpoint is invalid, the IDE ...
Get IntelliJ IDEA Essentials now with the O’Reilly learning platform.
O’Reilly members experience books, live events, courses curated by job role, and more from O’Reilly and nearly 200 top publishers.

