Eurepo Charts
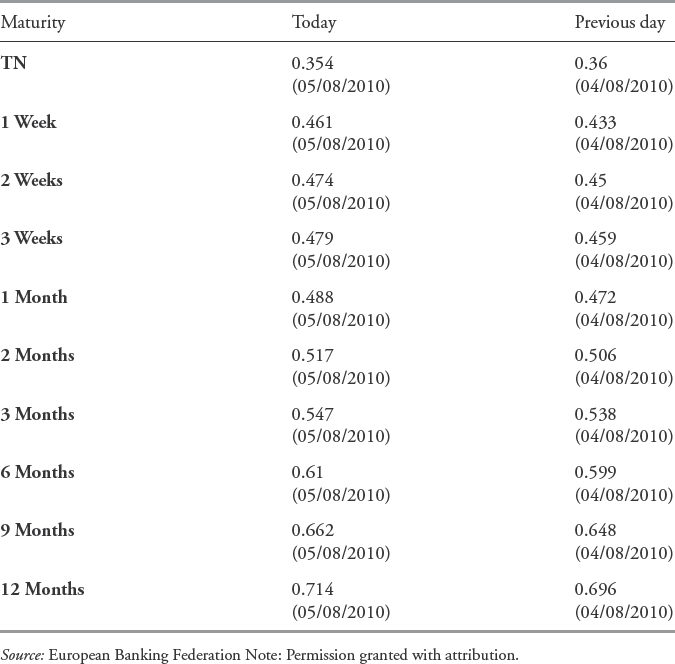
Provided in Exhibit 4.1 is a 12-month chart from the European Banking Federation's EURIBOR section that tracks repo rates. Trades and repo rates range from Tom/Next to 12 months.
EXHIBIT 4.1 12-Month Chart of Eurepo: 2008
Get Inside the Currency Market: Mechanics, Valuation, and Strategies now with the O’Reilly learning platform.
O’Reilly members experience books, live events, courses curated by job role, and more from O’Reilly and nearly 200 top publishers.

