29.5 General Graphical Display of Reliability Data
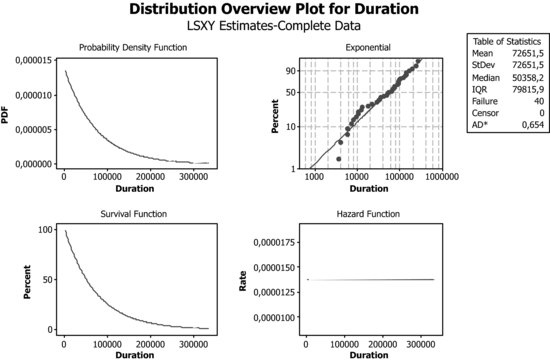
A quick way to produce the reliability and risk functions, from either a parametric or nonparametric analysis, is via: Stat > Reliability/Survival > Distribution Analysis (Right Censoring) > Distribution Overview Plot
In Variables place the column C1 (containing lifetime data). Enable the Parametric analysis option, with the Exponential distribution, to obtain:
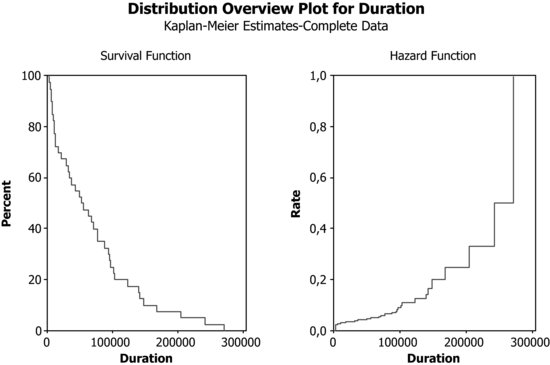
With the nonparametric analysis, the plots are:
Get Industrial Statistics with Minitab now with the O’Reilly learning platform.
O’Reilly members experience books, live events, courses curated by job role, and more from O’Reilly and nearly 200 top publishers.

