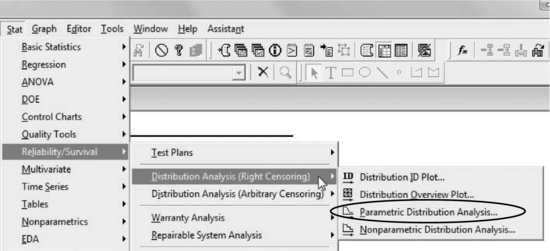
29.4 Parametric Analysis
The parametric analysis assumes a theoretical model for the data (exponential, Weibull, lognormal, etc.). The identification of the distribution that best fits the data is achieved through Distribution ID Plot, as previously seen.
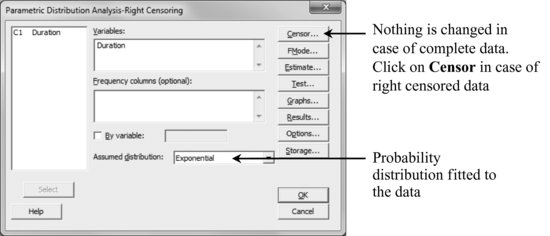
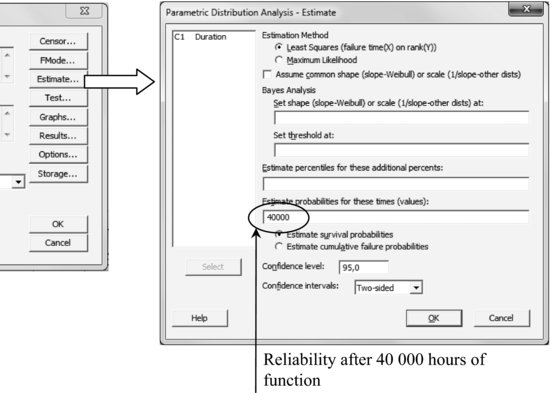
Stat > Reliability/Survival > Distribution Analysis (Right Censoring) > Parametric Distribution Analysis
This allows the estimation of reliability values, and to draw reliability and risk functions for complete or right censored data assuming a theoretical model for the data.
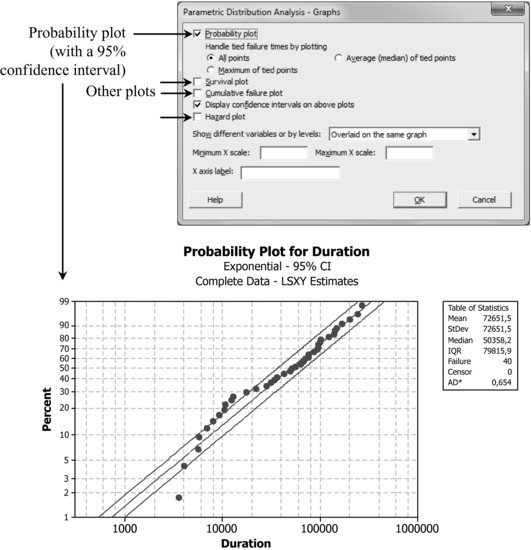
29.4.1 Graphs
The session window after carrying out a parametric analysis looks as follows:
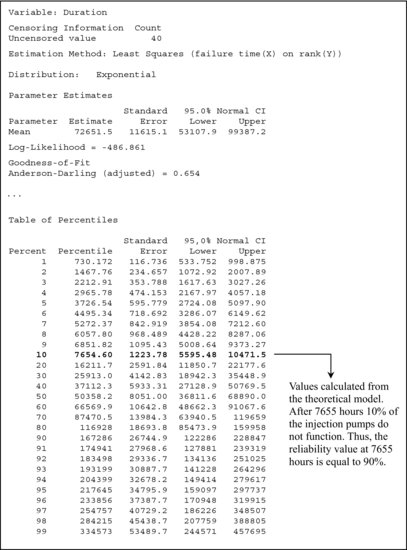
What is the reliability value after 40 000 hours of functioning?
The Minitab output is:
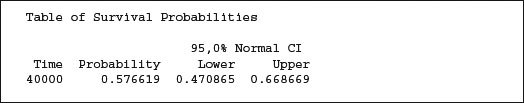
Thus, the reliability value at 40 000 hours is equal to 0.5766. The reliability value obtained (at 40 000 hours) from a parametric (assuming an exponential model) or nonparametric ...
Get Industrial Statistics with Minitab now with the O’Reilly learning platform.
O’Reilly members experience books, live events, courses curated by job role, and more from O’Reilly and nearly 200 top publishers.

