29.3 Identification of the Best Model for the Data
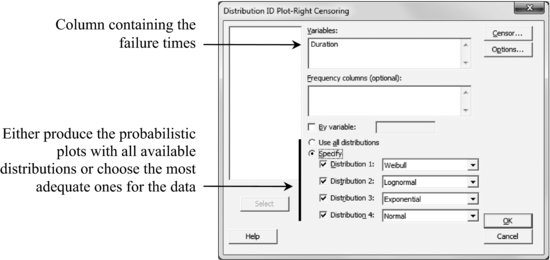
Stat > Reliability/Survival > Distribution Analysis (Right Censoring) > Distribution ID Plot
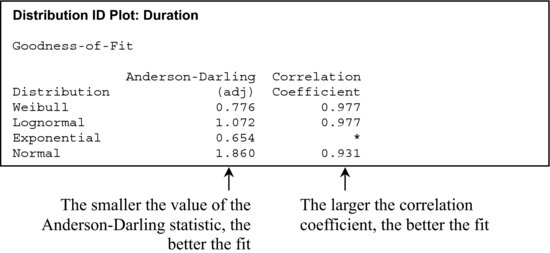
The first block on the Minitab output session window displays the goodness of fit statistics that will allow you to find the best model for the data:
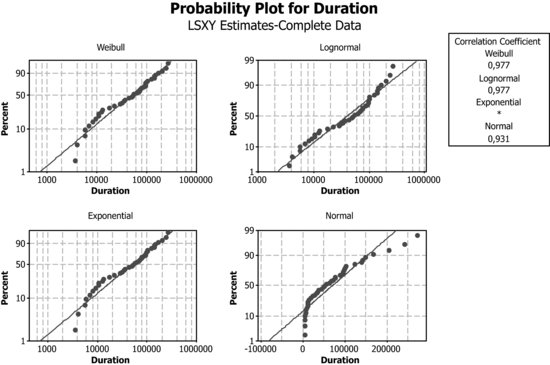
The plot showing more aligned points corresponds to the distribution that best fits the data.
Get Industrial Statistics with Minitab now with the O’Reilly learning platform.
O’Reilly members experience books, live events, courses curated by job role, and more from O’Reilly and nearly 200 top publishers.

