27.3 A Recap with a Fractional Factorial Design
Example 27.2:
Consider again the second example of the previous chapter where a 25-2 factorial design was carried out to improve the label's strength of adhesion of cava bottles. The five studied factors are: type of glue, temperature of glue, quantity of glue, drying temperature and brush pressure.
The Minitab worksheet window including the response variable looks as follows:

Choose Stat > DOE > Factorial > Analyze Factorial Design, using the column C10 as response and choosing the Graphs option to display the effects in a normal probability plot, to obtain:
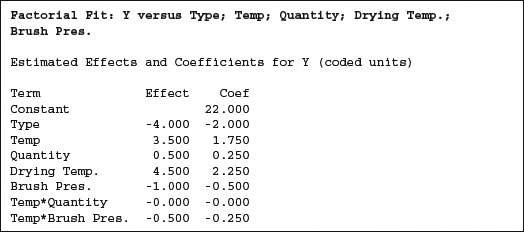
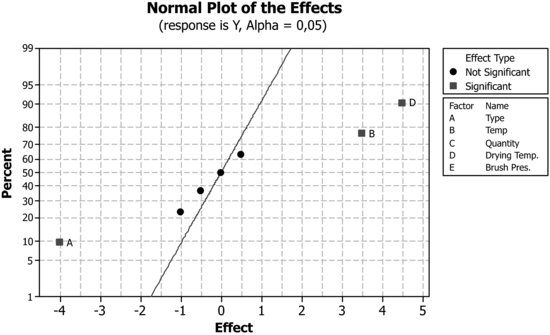
The resulting significant effects are A+BD+CE, B+AD and D+AB.
Although Minitab only labels the significant main effects on the plot, remember that a 25-2 factorial design has resolution III, and thus the main effects are confounded with order two interactions.
The confounding pattern was previously obtained when the design matrix was created by choosing Stat > ...
Get Industrial Statistics with Minitab now with the O’Reilly learning platform.
O’Reilly members experience books, live events, courses curated by job role, and more from O’Reilly and nearly 200 top publishers.

