27.2 Interpretation of Results
In this example, the resulting significant effects are the main effect A (Gas Flow = 9) and the interaction AB (Gas Flow × Intensity = −6,5). Factor C (speed of the production chain) is inert.
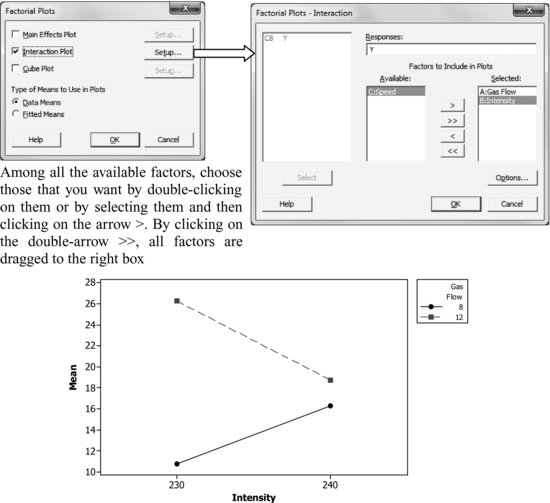
Since factors A and B interact, it is necessary to draw an interaction plot to interpret the results. To do so, choose Stat > DOE > Factorial > Factorial Plots.
Use first the option Interaction Plot.
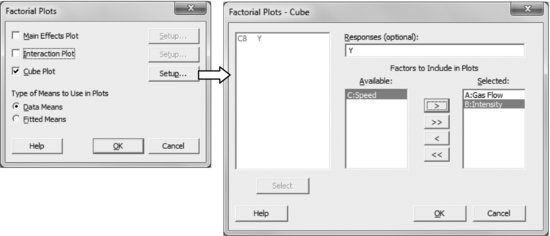
Use now the option Cube Plot. The displayed dialog box looks similar to the previous one.
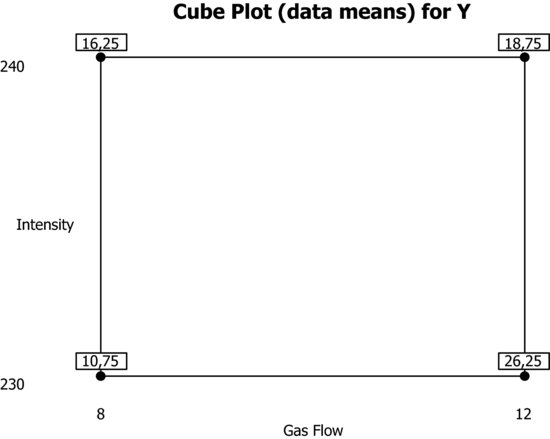
The two interaction plots are equivalent; from one you can build the other (the following plots have been edited to increase the font size of the numbers):
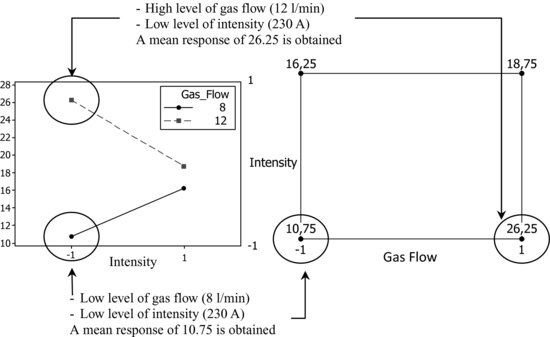
The best result is obtained with a gas flow of 12 l/min and an intensity of 230 A. Note that if you ever need, whatever the ...
Get Industrial Statistics with Minitab now with the O’Reilly learning platform.
O’Reilly members experience books, live events, courses curated by job role, and more from O’Reilly and nearly 200 top publishers.

