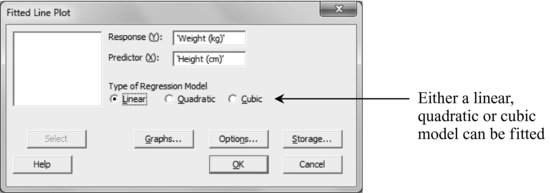
22.3 Simple Regression with ‘Fitted Line Plot’
Stat > Regression > Fitted Line Plot
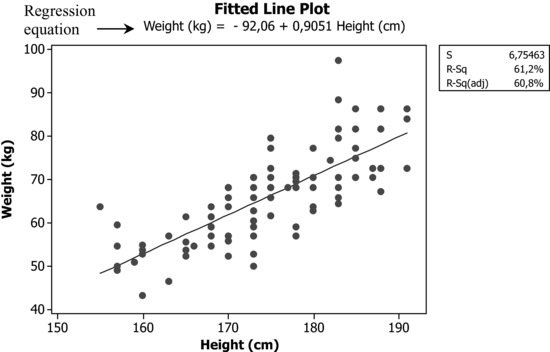
The goodness of fit indicators that appear in the upper-right box of the scatterplot are:
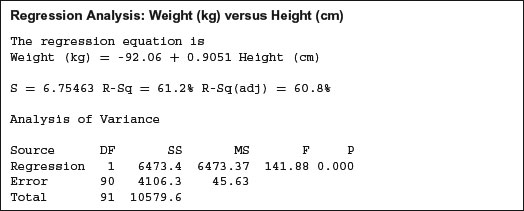
The session window only adds the analysis of variance table, which can be used as a significance test for the coefficient of the explanatory variable. In our example, the coefficient of the height variable is clearly significant since the p-value = 0.000.
22.3.1 Logarithmic Transformation of Data (Using ‘Options’)
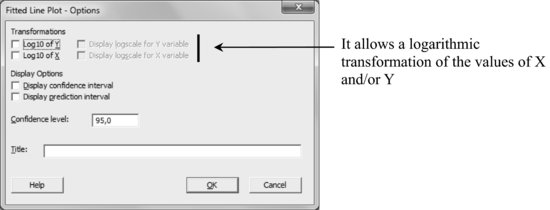
Sometimes, a much better model can be obtained using a logarithmic transformation of the values of X and/or Y. An example of a remarkable model improvement is obtained ...
Get Industrial Statistics with Minitab now with the O’Reilly learning platform.
O’Reilly members experience books, live events, courses curated by job role, and more from O’Reilly and nearly 200 top publishers.

