21.4 Plastic (1st Part)
Which conclusions can be drawn from the ![]() - R chart? For this, using all default options, choose:
- R chart? For this, using all default options, choose:
Stat > Control Charts > Variables Charts for Subgroups > Xbar–R. All observations for a chart are in one column: Length. Subgroup sizes: 4.
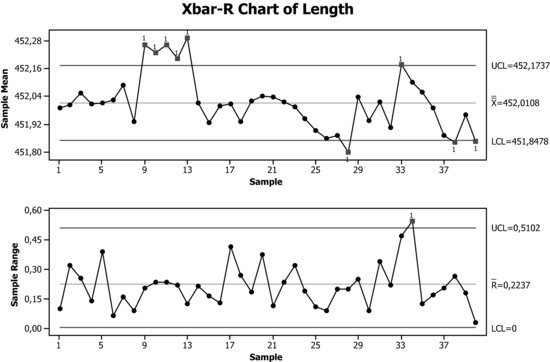
The process is clearly out of control. The R chart shows only one point outside the control limits (the rest does not seem to indicate signs of special causes).
The graph of the sample shows a nonrandom behaviour. During the first hours of the second day (around sample 10), there is a clear increase in the length ...
Get Industrial Statistics with Minitab now with the O’Reilly learning platform.
O’Reilly members experience books, live events, courses curated by job role, and more from O’Reilly and nearly 200 top publishers.

