21.3 Mattresses (2nd Part)
With these data and all default options, draw again a ![]() - R chart:
- R chart:
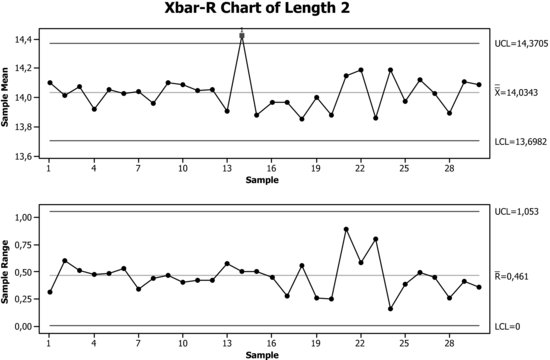
The process is, basically, in a state of control. Nonetheless, the point detected outside the control limits needs to be investigated in order to find the cause that produced that behaviour. For a more detailed study, use the Capability Sixpack tool.
Stat > Quality Tools > Capability Sixpack > Normal
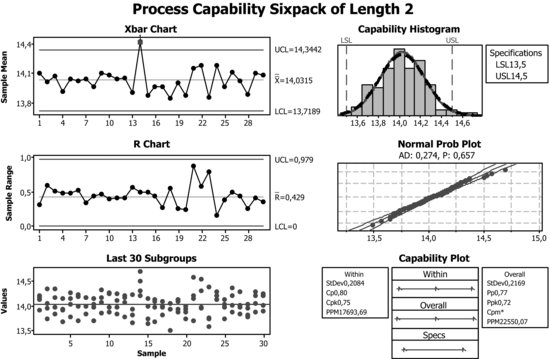
Clicking on Options, enter 30 in Number of subgroups display: Last so that the points of all samples are displayed in the graph named Last 30 subgroups, in such a way that they are aligned with their means and ranges.
The data follow a normal distribution reasonably well and the process is, basically, in state of control. ...
Get Industrial Statistics with Minitab now with the O’Reilly learning platform.
O’Reilly members experience books, live events, courses curated by job role, and more from O’Reilly and nearly 200 top publishers.

