21.2 Mattresses (1st Part)
A manufacturing process of springs for mattresses produces 3000 of such type of springs per hour, working continuously from 7 a.m to 10 p.m. As part of a Six Sigma improvement project, the decision is taken to implement a statistical control of this process. For this, every three hours a sample of 4 springs is taken and their length is measured by applying a force of 1 kg. According to the specifications, under these conditions, the length should be between 13.5 and 14.5 cm.
The data corresponding to the first week are in columns named Length 1, Time 1, and Day 1 of file MATTRESSES.MTW (the other three columns will be used in the second part of this case).
We are interested in which conclusions can be drawn from the  - R control chart constructed using the data of the first week, and whether we deal with a capable process.
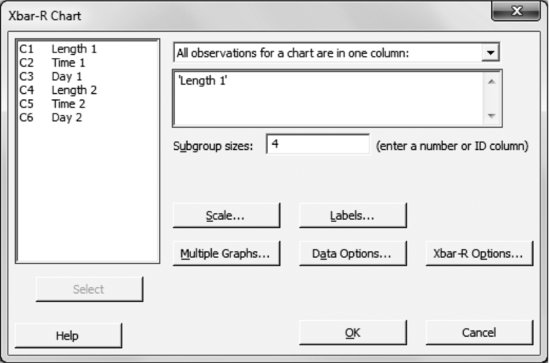
To draw the ![]() - R chart, do the following.
- R chart, do the following.
Stat > Control Charts > Variables Charts for Subgroups > Xbar–R
In the graphs obtained, two special causes are clearly identified. One is periodic: every day at 7 a.m., the springs are too long (they are only slightly compressed). The other cause is linked to an increase of the variability ...
Get Industrial Statistics with Minitab now with the O’Reilly learning platform.
O’Reilly members experience books, live events, courses curated by job role, and more from O’Reilly and nearly 200 top publishers.

