20.7 Plotting the Number of Defects per Variable Unit of Measurement (U)
Similarly to previous cases, using the data in file FABRIC.MTW, proceed to draw a U chart as follows.
Stat > Control Charts > Attributes Charts > U
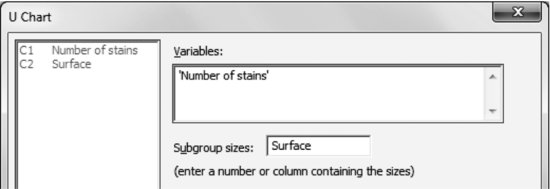
Using all default options, one obtains:
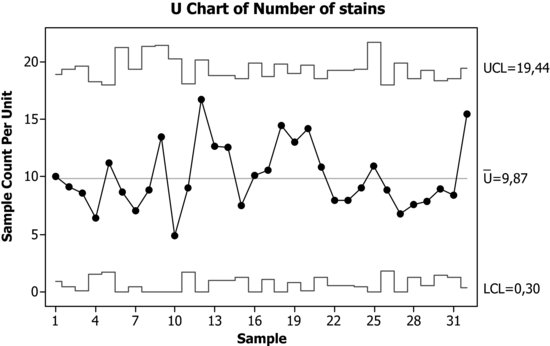
Tests performed with unequal sample sizes
The process is under statistical control. The limits vary because the sample sizes also vary.
When the control limits are not constant, the values of the upper and lower limits shown by Minitab are the ones from the last sample.
Get Industrial Statistics with Minitab now with the O’Reilly learning platform.
O’Reilly members experience books, live events, courses curated by job role, and more from O’Reilly and nearly 200 top publishers.

