20.5 Plotting the Number of Defects per Constant Unit of Measurement (C)
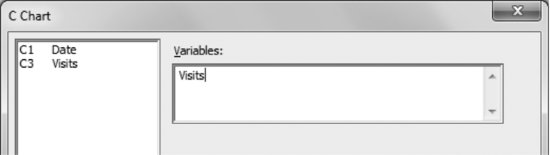
The number of daily visits can be assumed to follow a Poisson distribution, and as the unit of measurement is constant (one day), a C chart can be used to represent its evolution.
Stat > Control Charts > Attributes Charts > C
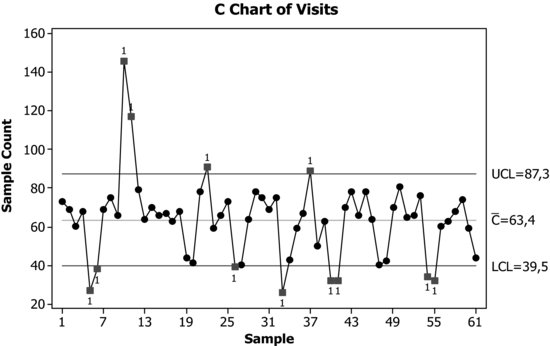
The marked peak observed around day 10 is due to a newspaper advertisement of this website, clearly implying the presence of a special cause. Additionally, the so-called valleys, many of which also lie outside the limits, correspond to weekends when a remarkably smaller number of visits are produced in contrast to working days.
Using the Data options button, we remove the data corresponding to Saturdays and Sundays from the chart:
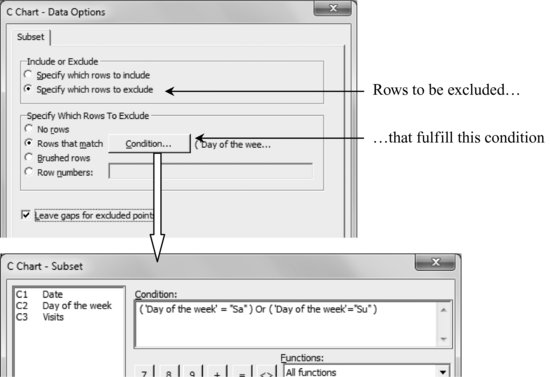
Then, the following chart is obtained, where the limits were recomputed based only on the remaining points. ...
Get Industrial Statistics with Minitab now with the O’Reilly learning platform.
O’Reilly members experience books, live events, courses curated by job role, and more from O’Reilly and nearly 200 top publishers.

