19.5 Some Ideas on How to Use Minitab as a Simulator of Processes for Didactic Reasons
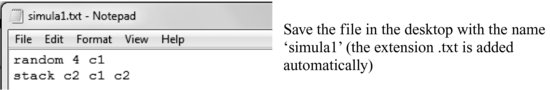
Using the possibility of automatically updating the graphs and the use of macros or executable files, the evolution of a control chart can be simulated. The next file should be first created using: Tools > Notepad.
To indicate Minitab where to find the files to be executed later, do: Tools > Options:
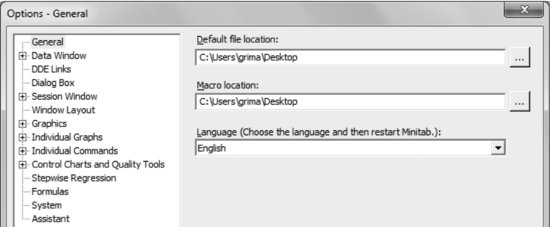
We have indicated that the files are located on the desktop (use the button with three dots to locate the situation in your computer).
Now, place four values from a Normal (0; 1) in column C2. This can be done via Calc > Random Data > Normal, but it can also be done simply by typing the following command in the session window (the option Enable Commands must first be activated):
MTB > random 4 c2
Create now the chart Xbar-R using: Stat > Control Charts > Variables Charts for Subgroups > Xbar-R
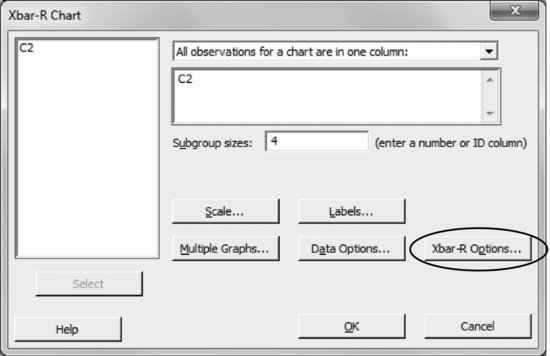
To avoid that limits changing as the points appear, use the option:
Xbar-R Options > Parameters: Mean ...
Get Industrial Statistics with Minitab now with the O’Reilly learning platform.
O’Reilly members experience books, live events, courses curated by job role, and more from O’Reilly and nearly 200 top publishers.

