19.4 Graphs of Means-Ranges
Stat > Control Charts > Variables Charts for Subgroups > Xbar-R
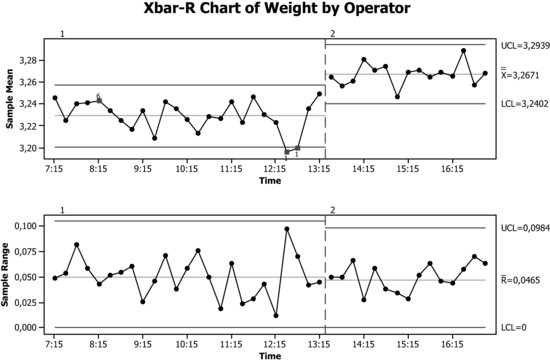
Choosing the options already used for the Xbar graph, one obtains:
The examples of control charts created on a set of data can give the false impression that the data are first taken and then, once all are collected, the graph is drawn. This is not the case. To rapidly react to the coming problems, the chart must be created as the data are being collected, point by point.
Get Industrial Statistics with Minitab now with the O’Reilly learning platform.
O’Reilly members experience books, live events, courses curated by job role, and more from O’Reilly and nearly 200 top publishers.

