19.2 Means Chart
Stat > Control Charts > Variables Charts for Subgroups > Xbar
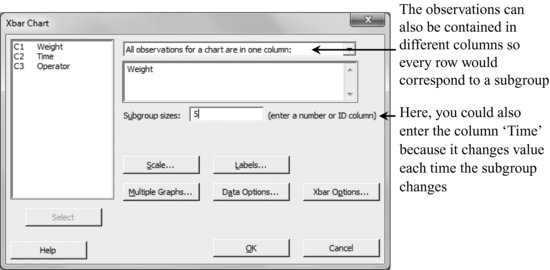
The options are identical to the ones used in charts for individual observations (see Chapter 18). We will use them in the following way:
Scale > Time: Mark the option Stamp and place as variable ‘Time’.
Xbar Options > Tests: Mark the 8 tests (or choose the option Perform all tests for special causes).
Xbar Options > Stages: Define stages… Operator.
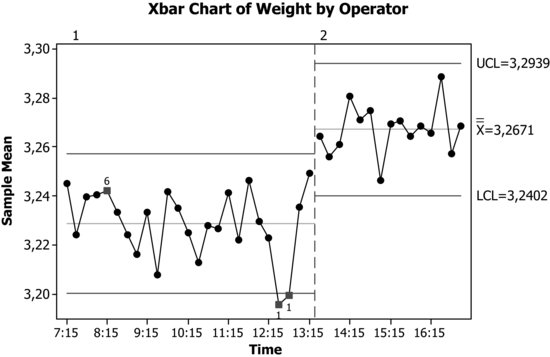
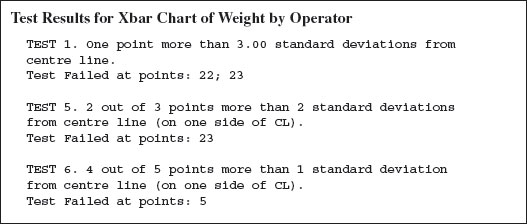
In the session window one finds information on the points out of control. The chart indicates only one test for each point; even if, as happens with point 23, it fails in several.
Get Industrial Statistics with Minitab now with the O’Reilly learning platform.
O’Reilly members experience books, live events, courses curated by job role, and more from O’Reilly and nearly 200 top publishers.

