19.1 File ‘VITA_C’
Consider again the file VITA_C.MTW presented in Chapter 14 (capability studies). From a machine producing pills, samples of 5 units are taken every 15 minutes during 10 hours. Column C1, the only one containing data, contains measures corresponding to the weights of the sampled pills (40 samples × 5 pills/sample = 200 pills).
To illustrate better the possibilities of these type of plots, we create two new columns: the first contains the time (in hours) in which the datum is taken and the other contains a number identifying the worker operating the machine.
Calc > Make Patterned Data > Simple Set of Date/Time Values
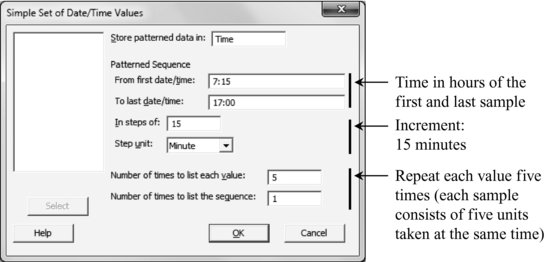
With respect to the worker, assume that the first 25 samples are taken from the machine operated by worker A, and the other 15 from the machine operated by worker B. This requires us to introduce in column C3 125 (25 × 5) A's and 75 (15 × 5) B’s.
Since the number of A's is distinct from the number of B’s, the option Make Patterned Data cannot be used (although it could be used and then erase the last 50 B’s). A quick way to do it is to write directly in the session window (make sure the option Editor > Enable commands is checked):
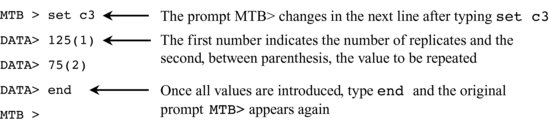
The name of the column must be introduced ‘by hand’.
Get Industrial Statistics with Minitab now with the O’Reilly learning platform.
O’Reilly members experience books, live events, courses curated by job role, and more from O’Reilly and nearly 200 top publishers.

