18.4 I Chart Options
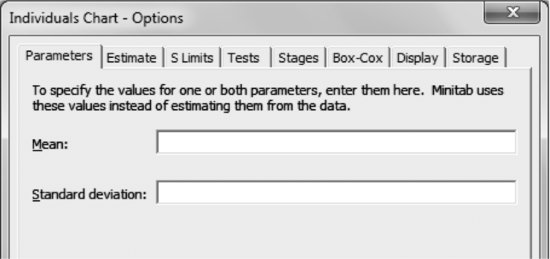
Parameters
Allows entering the mean and standard deviation of the process and Minitab calculates the limits with both values. By default, these parameters are estimated from the data.
Estimate
It allows you to skip samples (subgroups) from the calculation of the limits. This is useful when you have the certainty of the presence of special causes in a sample.
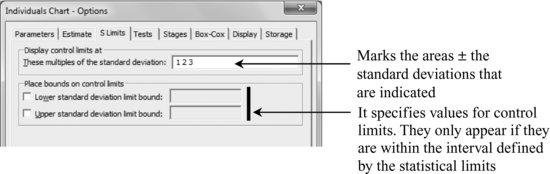
S Limits
Tests
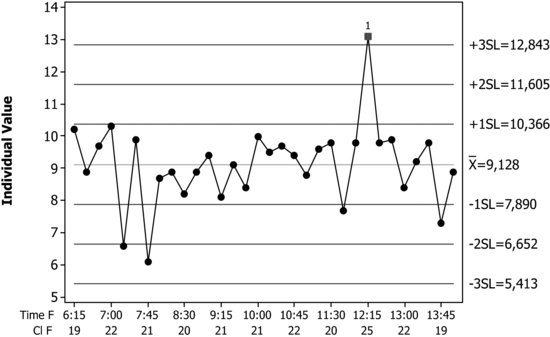
By default, only the symptom of special cause for one point beyond the limits (pattern 1) is activated. There are eight symptoms available and it is possible to activate the ones of interest by this option.
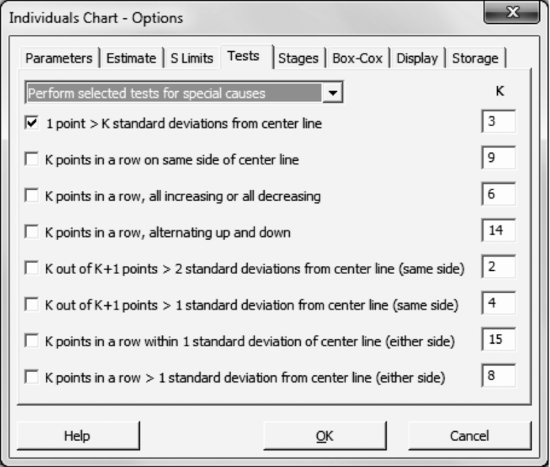
In our case, if all options are activated two more points appear marked with pattern 5 (two out of three beyond two sigmas) and pattern 7 (15 consecutive points within one standard deviation from the mean).
Stages
Mark groups on the graph. We go back and change variable ‘pH F’ (Friday's pH value) by ‘pH’ (all days' ...
Get Industrial Statistics with Minitab now with the O’Reilly learning platform.
O’Reilly members experience books, live events, courses curated by job role, and more from O’Reilly and nearly 200 top publishers.

