18.3 Customizing the Graph
Scale
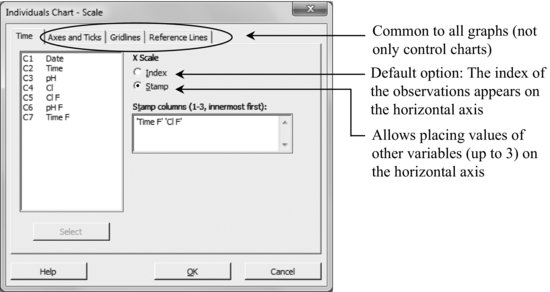
Remember: By double-clicking on any axis its values can be changed.
Labels
This allows the addition of titles and comments at the bottom.
Multiple Graphs
If multiple graphs are drawn, the vertical scale can be forced to be same for all.
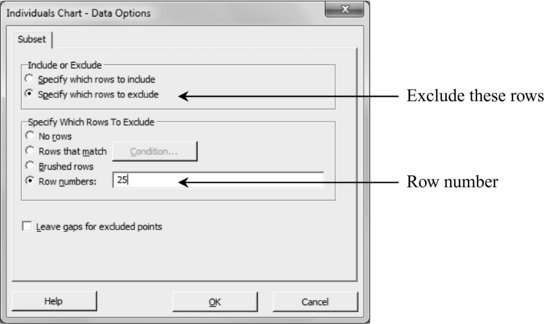
Data Options
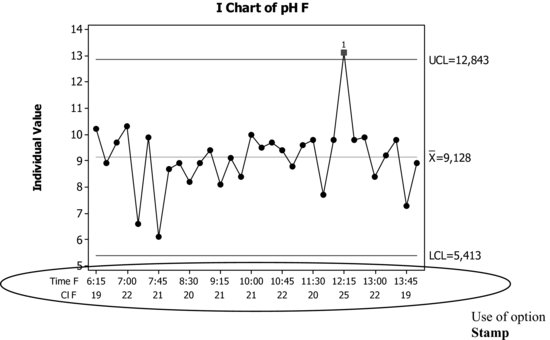
This allows the selection of the values to be represented. For example, with option Brush (Editor > Brush, with the graph window being active) we can see that the point outside the control limits is the one in row 25. If you want to exclude it, do the following:
Get Industrial Statistics with Minitab now with the O’Reilly learning platform.
O’Reilly members experience books, live events, courses curated by job role, and more from O’Reilly and nearly 200 top publishers.

