17.2 Multi-Vari Chart with Three Sources of Variation
Data in MUFFIN.MTW file were collected taking into account that height variability could be due to:
- differences between the left and right parts of a tray;
- differences between top and bottom parts of a tray;
- variability among muffins baked in consecutive trays (short term variability);
- variability due to time (long term).
Multi-vari charts allow visualizing the relative importance of each source of variability. To achieve this, do as follows.
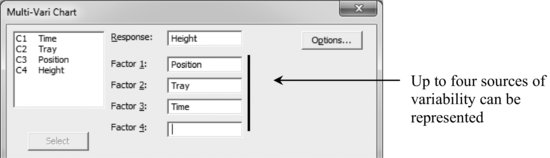
Stat > Quality Tools > Multi-Vari Chart
With all options by default, the following chart is obtained:
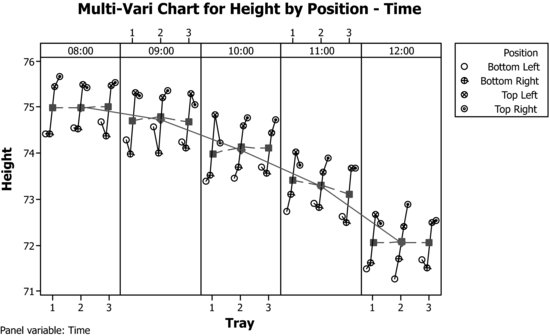
The most important source of variability is due to changes over time (probably, because temperature in the oven tends to decrease, preventing muffins to acquire their nominal height). It is represented by the line connecting diamond-shaped points. The second source of variability is due to the position of the muffin in the tray. Finally, the last source of variability is short-term variability among trays. This source of variability is much smaller than the others.
Multi-vari options allow removing the connecting lines. This is sometimes very useful to make the graph more clear to interpret. For instance, to remove the lines connecting positions in each tray, go to Options:
Get Industrial Statistics with Minitab now with the O’Reilly learning platform.
O’Reilly members experience books, live events, courses curated by job role, and more from O’Reilly and nearly 200 top publishers.

