16.3 Diameter_capability_2
Proceed to carry out a capability study going to:
Stat > Quality Tools > Capability Analysis > Normal
In the dialog box, it is only necessary to indicate that the data are in the Single column: C1, that the Subgroup size is 50, and that the specification limits are 7.4 and 7.6.
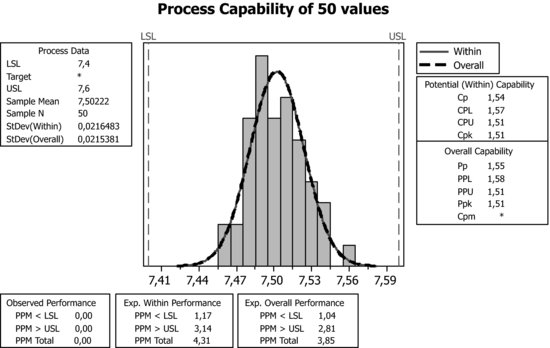
Everything appears correct in the graphical output of the capability study. Also, it is important to analyze whether there is any tendency among the data. In this case, we cannot use Capability Sixpack since only one single point is shown on the control graph (there is only one sample of size 50). Thus, it is more appropriate to make a control graph for the individual observations, as shown below.
Stat > Control Charts > Variables Charts for Individuals > Individuals
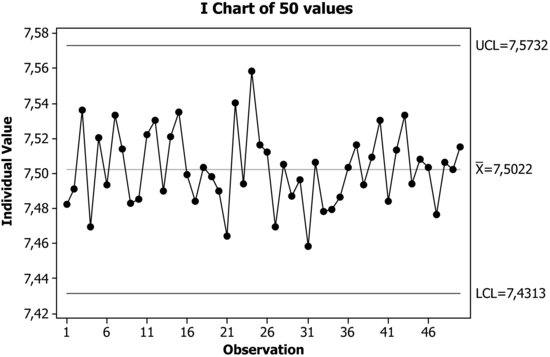
In the above graph, nothing in particular is observed. Hence, the production can be started.
Get Industrial Statistics with Minitab now with the O’Reilly learning platform.
O’Reilly members experience books, live events, courses curated by job role, and more from O’Reilly and nearly 200 top publishers.

