16.2 Diameter_capability_1
Use: Stat > Quality Tools > Capability Sixpack > Normal
Since the data are organized by rows, use the option Subgroups across rows of: and introduce C2-C6. Remember that the specifications are 7.5 ± 0.1.
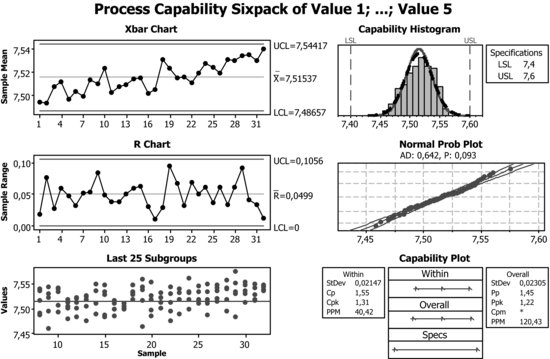
An evident conclusion obtained from the graph of the sample means (Xbar Chart) is that the process becomes decentred towards larger values. The reason for that should be studied; perhaps it is a badly calibrated machine, a wear and tear of the tools, etc. Concerning the range chart, there is nothing to object. The histogram is decentred with respect to the target value; the default values of the scale are changed to show this more clearly.
The required capability index Cp > 1.33 is met in this case (also Pp > 1.33), although it appears ...
Get Industrial Statistics with Minitab now with the O’Reilly learning platform.
O’Reilly members experience books, live events, courses curated by job role, and more from O’Reilly and nearly 200 top publishers.

