15.4 Capability Study for Variables that Follow a Poisson Distribution
Here, use the file OVEN_PAINTED.MTW since the number of defects per unit is a typical example of a variable that follows a Poisson distribution.
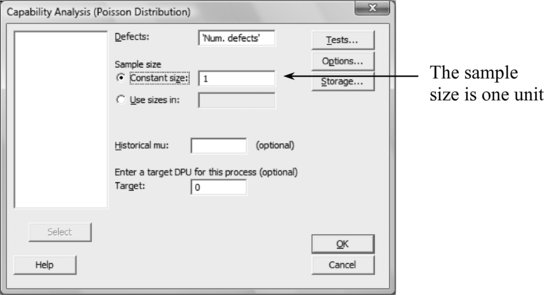
Stat > Quality Tools > Capability Analysis (Poisson)
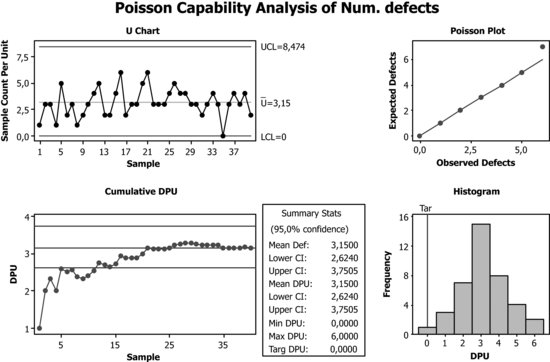
The process remains stable at about 3 defects per unit. The graph of the cumulative average value indicates that the number of samples is sufficient. Additionally, the Poisson Plot suggests that the hypothesis that the data follows a Poisson distribution is perfectly reasonable.
Get Industrial Statistics with Minitab now with the O’Reilly learning platform.
O’Reilly members experience books, live events, courses curated by job role, and more from O’Reilly and nearly 200 top publishers.

