15.2 Capability Study for Variables that Follow a Binomial Distribution
The number of unsatisfied customers in file BANK.MTW is a typical example of a variable that follows a binomial distribution. It must be assumed that all of the agencies have the same instructions, the same products, and that they all follow the same procedures in their relationships with their customers. The question of interest is to find out which is the percentage of unsatisfied customers that are produced by these products and the standard procedures of the bank.
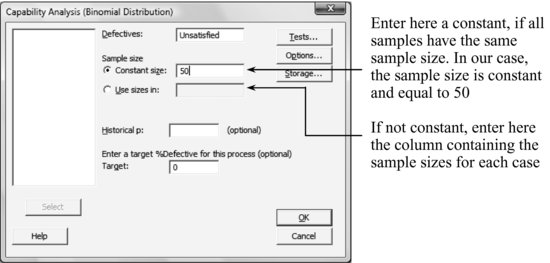
Stat > Quality Tools > Capability Analysis > Binomial
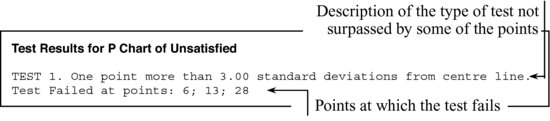
Output in the session window:
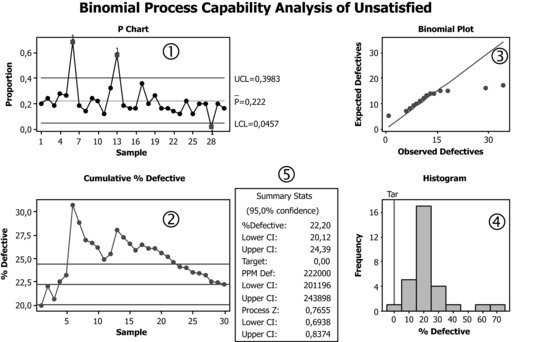
Graphical window:
Get Industrial Statistics with Minitab now with the O’Reilly learning platform.
O’Reilly members experience books, live events, courses curated by job role, and more from O’Reilly and nearly 200 top publishers.

