14.4 Interpreting the Obtained Information
The graphical window displayed below is obtained. In the following, you will find a detailed description of the results obtained:
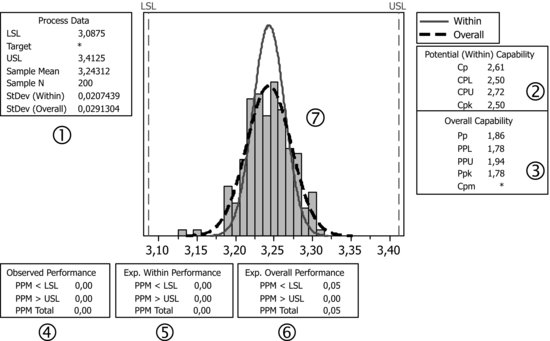
1. Process data: Lower and upper specification limits (LSL and USL, you must enter at least one). Target: shown if introduced previously (optional). Global data mean (Sample Mean), total number of data values (Sample N), standard deviations estimated via the variability within the samples (StDev (Within)) and via the global variability (StDev(Overall)).
2. Short time capability indexes (also called ‘machine capability’): These indexes are computed from the variation within the samples. To see the detailed formulas, click on Help in the dialog window Capability Analysis (Normal Distribution), then click on the option: see also (top right of the displayed window) and finally choose the topic: Methods and formulas.
3. Similar to item two, but based on the global variability (long-term capability or process capability).
4. Number of values in parts per million (PPM) that are observed outside (below and above) the specification limits.
5. Expected PPM outside specifications obtained based on the variation within samples. This theoretical value that reflects the variability is obtained from the normal distribution, centred at the sample mean.
6. Similar to the above, but based on the global or total variation. ...
Get Industrial Statistics with Minitab now with the O’Reilly learning platform.
O’Reilly members experience books, live events, courses curated by job role, and more from O’Reilly and nearly 200 top publishers.

