13.4 R&R Study for the Data in File ‘RR_CROSSED’
In this case, the adequate approach is a crossed design since each operator measures all parts several times. Thus, go to: Stat > Quality Tools > Gage Study > Gage R&R Study (Crossed)
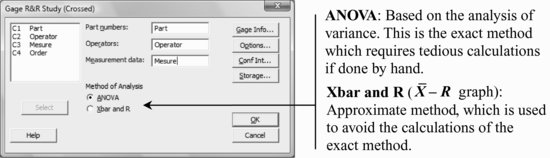
With Minitab, the use of ANOVA is recommended, which is actually the default option. The Xbar and R method is only advisable for comparison with other studies conducted with this method.
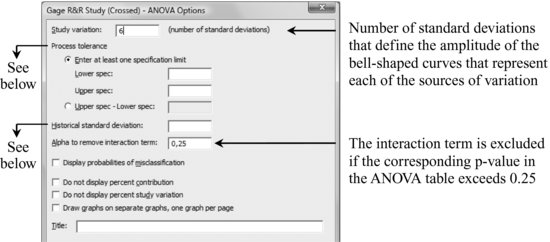
Options, with all default values:
The results shown in the Session window can be divided into three parts: (1) tables of the analysis of variance; (2) table of the variance components; (3) table of the study of variation.
13.4.1 ...
Get Industrial Statistics with Minitab now with the O’Reilly learning platform.
O’Reilly members experience books, live events, courses curated by job role, and more from O’Reilly and nearly 200 top publishers.

