12.4 Arrow
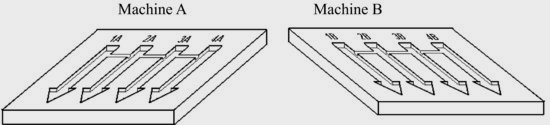
An arrow shaped plastic pieces are made with two injection moulding machines: A and B. Each machine has its own mould with 4 cavities, as shown in the following figure:
Data is available on ARROW.MTW file:
| Column | Content |
| C1 C2 C3 C4 C5 | Defects found in the parts produced by machine A As C1, but for machine B Tensile strength of parts made in 15 injections with machine A (15×4 = 60 data) As C3 for machine B Cavity to which data from columns C3 and C4 belong. |
The questions we pose are:
1. Looking at the distribution of defects in each machine, should the improvement measures be equally prioritized for both machines?
2. As for the tensile strength, is there a difference between machines? And between cavities?
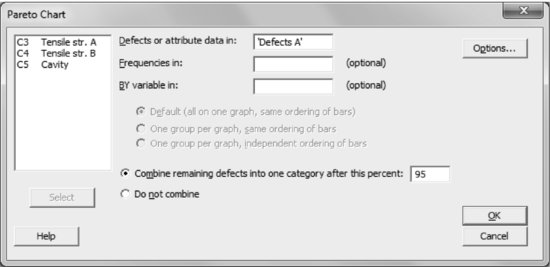
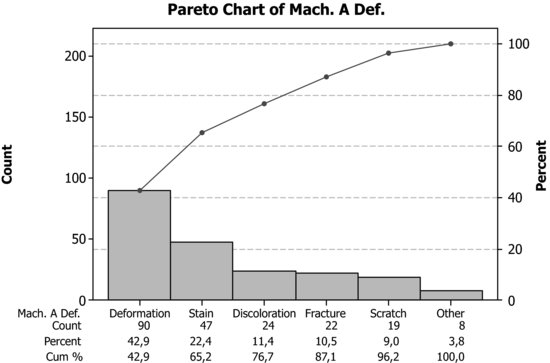
1. Let's see what is the distribution of defects in each machine by:
Stat > Quality Tools > Pareto Chart
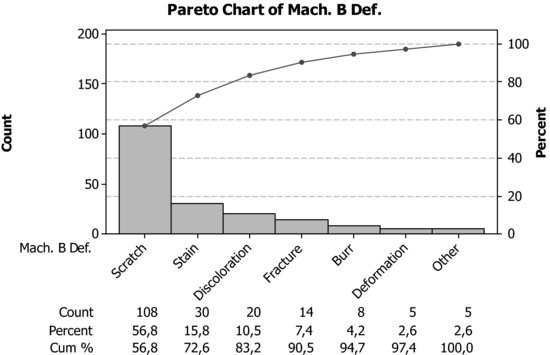
Doing the same for the machine B:
Assuming that the data are representative of both machines, it would be appropriate to focus on the problem of deformation in machine A and scratches in machine B.
2. First of all, a graphical analysis ...
Get Industrial Statistics with Minitab now with the O’Reilly learning platform.
O’Reilly members experience books, live events, courses curated by job role, and more from O’Reilly and nearly 200 top publishers.

