10.3 Comparison of Two Proportions
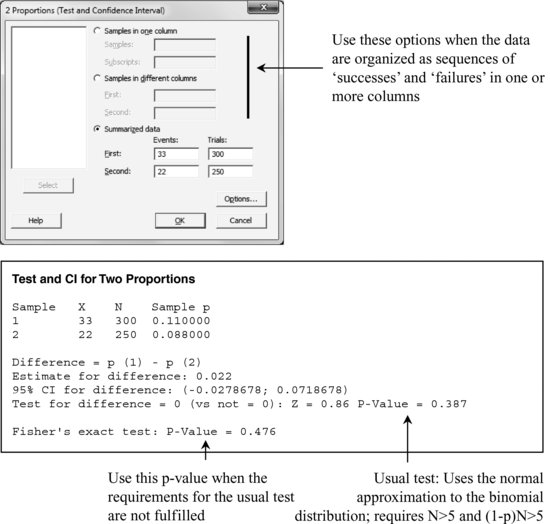
Stat > Basic Statistics > 2 Proportions
In this case, it is not necessary to enter values in the worksheet, since they are entered directly in the dialog box.

In any of the two cases, since the p-value is greater than 0.05 (usual critical value), it is not possible to conclude that the proportions are significantly different.
Get Industrial Statistics with Minitab now with the O’Reilly learning platform.
O’Reilly members experience books, live events, courses curated by job role, and more from O’Reilly and nearly 200 top publishers.

