9.3 Normality Test
To apply this test to the data of the detergent's weights presented before, go to: Stat > Basic Statistics > Normality Test
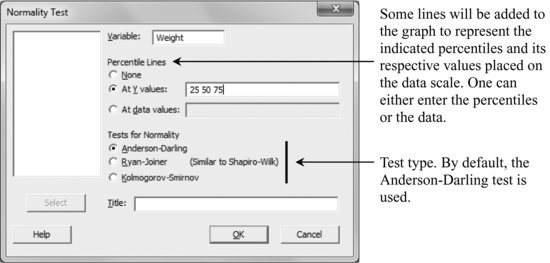
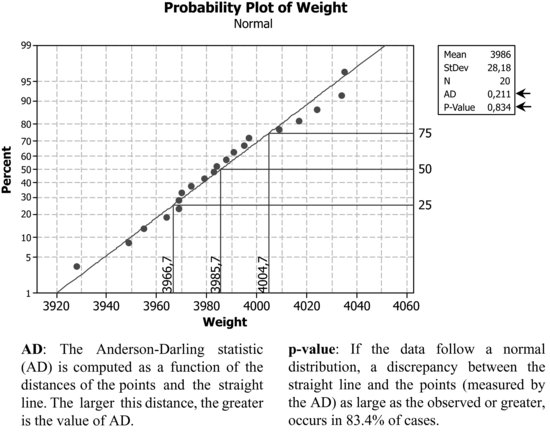
If the data come from a normal distribution, the values of their cumulative proportions will form approximately a straight line on a normal probability plot.
An alternative way to carry out the normality test is the following.
Graph > Probability Plot: Single
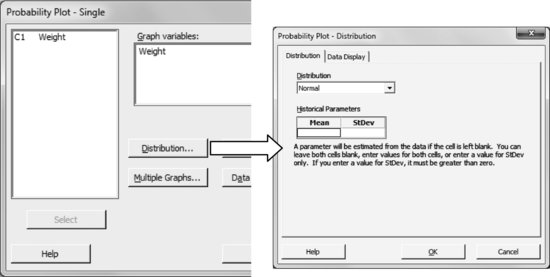
Notice that it is possible to fit other distributions. According to the chosen distribution, its parameters may be entered; however, this is optional as by default they are automatically estimated from the data.
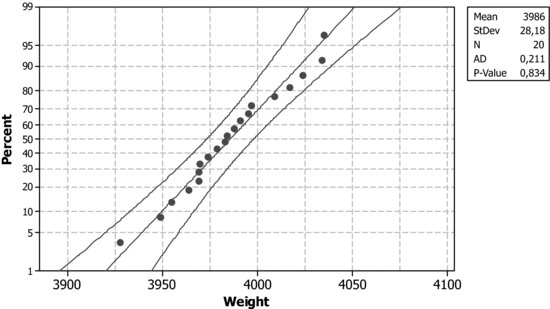
If the points lie within the confidence bands, it can be assumed that the values come from the distribution under study using a confidence level of 95%. This level can be changed in tab Data Display, the option which is found next to the Distribution tab.
Get Industrial Statistics with Minitab now with the O’Reilly learning platform.
O’Reilly members experience books, live events, courses curated by job role, and more from O’Reilly and nearly 200 top publishers.

