9.2 Hypothesis Testing and Confidence Interval for a Proportion
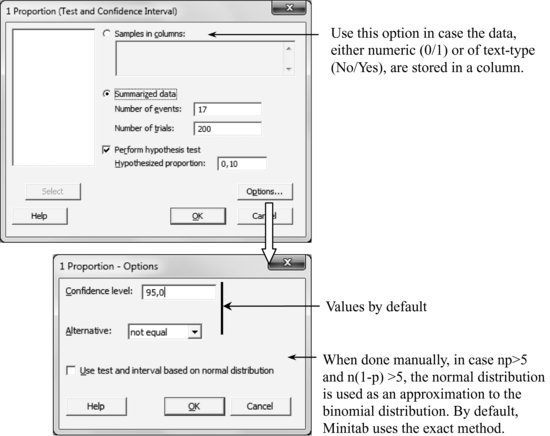
Stat > Basic Statistics > 1 Proportion
In this case, you do not need to enter the data in the worksheet. Instead, go directly to
Stat > Basic Statistics > 1 Proportion:
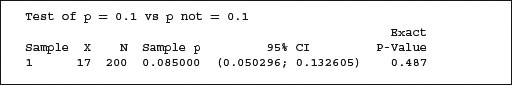
The result is:
Notice that the problem formulation guides us to choose the option ‘less than’ as alternative hypothesis, obtaining:
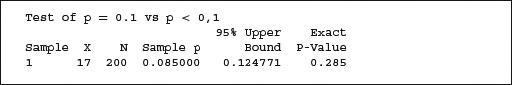
Given the obtained p-value of 0.285, clearly larger than 0.05, the survey data do not allow us to state that the percentage of users that use the new feature in question is less than 10%.
Get Industrial Statistics with Minitab now with the O’Reilly learning platform.
O’Reilly members experience books, live events, courses curated by job role, and more from O’Reilly and nearly 200 top publishers.

