9.1 Hypothesis Testing for One Mean
9.1.1 Case 1: Known Population Standard Deviation
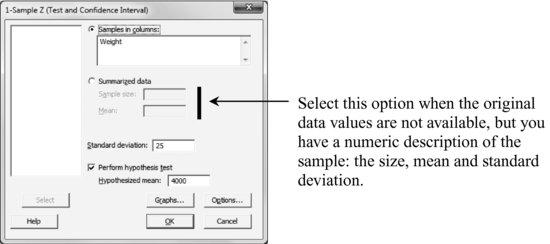
Stat > Basic Statistics > 1-Sample Z
Example 9.1:
A filling line of detergent packages must introduce 4 kg in each package. A sample of 20 units is taken and subsequently weighted (in grams) obtaining the following measures:
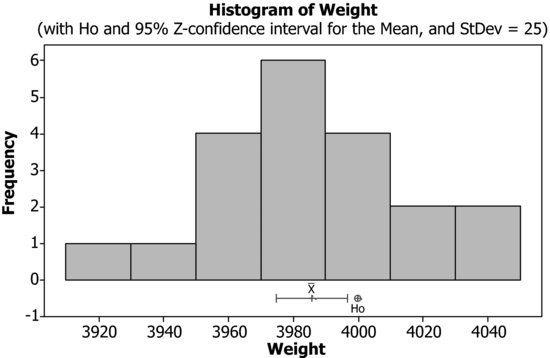
Historical data indicate a standard deviation of the weights of 25 g. Check if the process is not centred; that is, check if the mean of the packets’ weights is different from the target value of 4 kg.
Enter the data in column C1 and call it ‘Weights’. Then, go to Stat > Basic Statistics > 1-Sample Z:
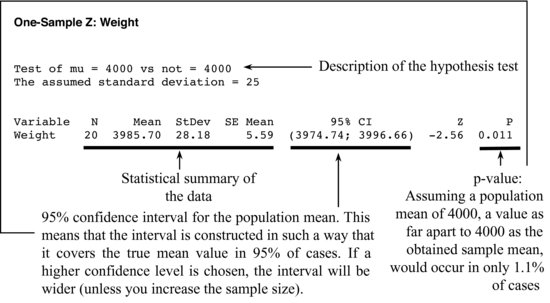
With all default options, the output is the following:
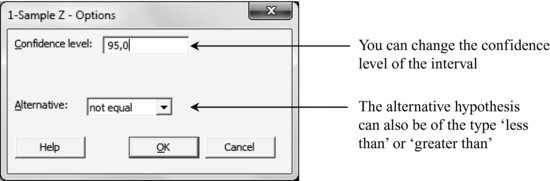
The options are:
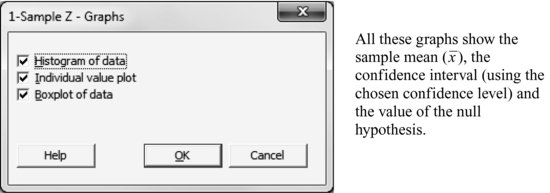
Notice that the button Graphs allows you to select any of the following graphs:
Get Industrial Statistics with Minitab now with the O’Reilly learning platform.
O’Reilly members experience books, live events, courses curated by job role, and more from O’Reilly and nearly 200 top publishers.

