8.5 Viewing the Shape of the Distributions
The shape of probability distributions can easily be represented using the option:
Graph > Probability Distribution Plot
For example, to illustrate how the shape of a Weibull distribution varies as a function of the shape parameter, with a fixed scale parameter equal to 1, do:
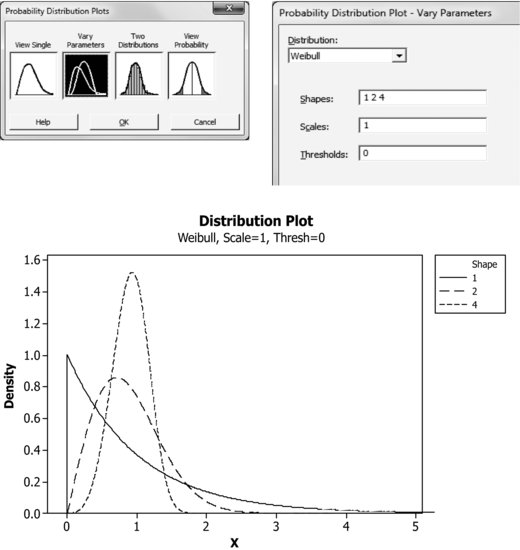
There are many options available that the reader could easily explore, especially useful for pedagogical purposes.
Get Industrial Statistics with Minitab now with the O’Reilly learning platform.
O’Reilly members experience books, live events, courses curated by job role, and more from O’Reilly and nearly 200 top publishers.

