5.3 Contour Plots
Graph > Contour Plot
Generate data points with Calc > Make Mesh Data:
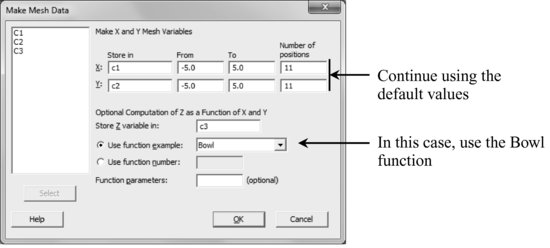
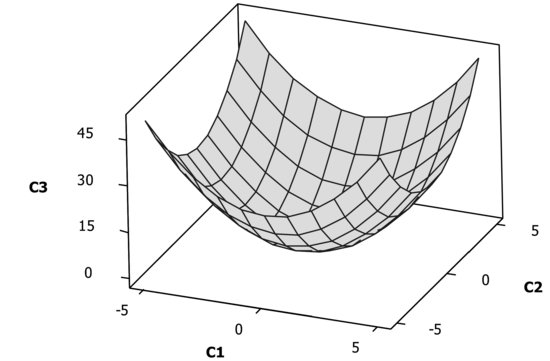
Graphing a mesh surface as follows.
Graph > 3D Surface Plot: Wireframe
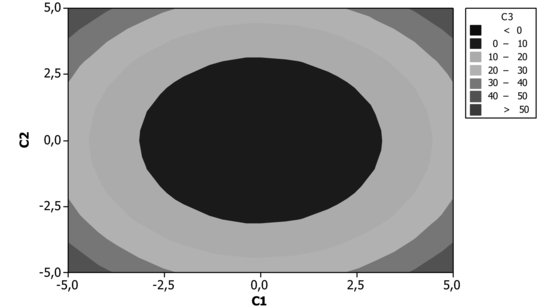
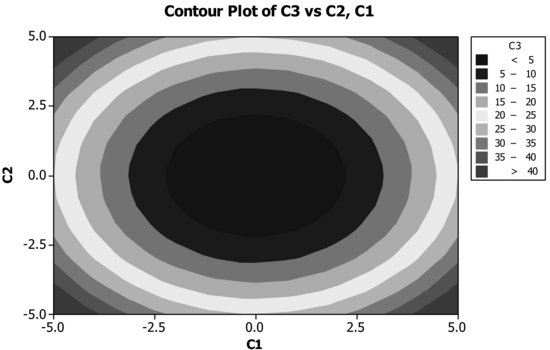
Graph > Contour Plot
5.3.1 Contour Plot Options
Double-clicking over the contour plot, a dialog box pops up with options to change the filling color pattern and the number of levels.
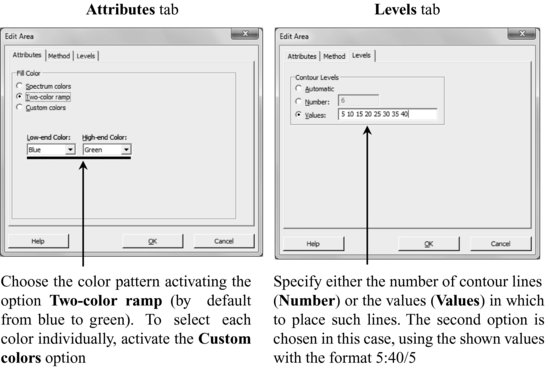
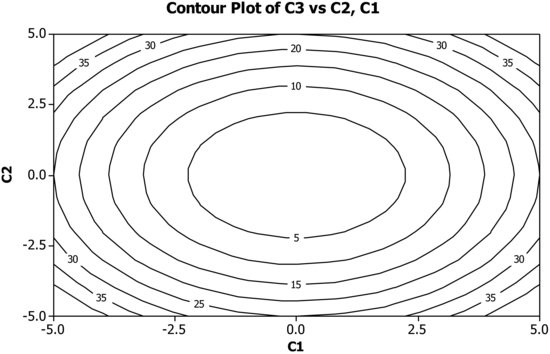
You can draw the contour lines without colors and indicating the value corresponding to each one of them. To do so, use the Data View options:
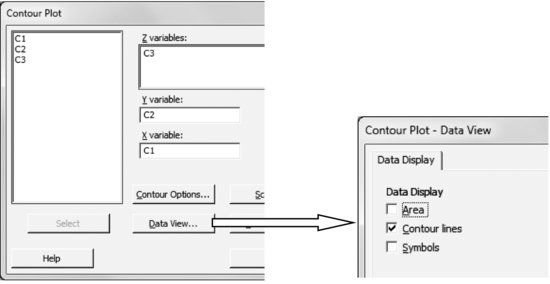
In Contour Options, you can indicate the values on which you want the contour lines.
Get Industrial Statistics with Minitab now with the O’Reilly learning platform.
O’Reilly members experience books, live events, courses curated by job role, and more from O’Reilly and nearly 200 top publishers.

