4.7 Creating an Array of Scatterplots
4.7.1 Square Matrix
Graph > Matrix Plot
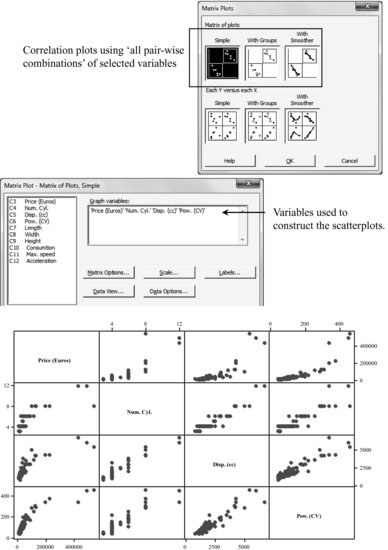
The use of too many variables produces plots difficult to interpret. Thus, any subset of variables may be chosen using the option: Each Y versus each X
4.7.2 Matrix Created Selecting a Subset of Variables
Graph > Matrix Plot: Each Y versus each X
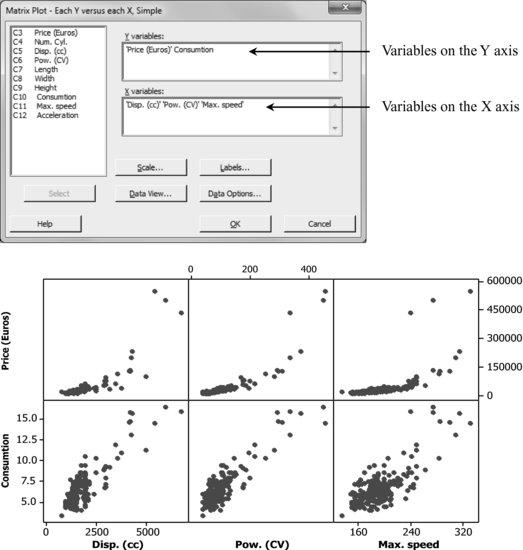
In Matrix Plots, you can activate the Brush option to select a data point in one plot and Minitab automatically does the same across plots. Selecting data points in an array of plots is much easier than doing so having several graphs windows open at once.
Get Industrial Statistics with Minitab now with the O’Reilly learning platform.
O’Reilly members experience books, live events, courses curated by job role, and more from O’Reilly and nearly 200 top publishers.

