2.8 Pie Charts
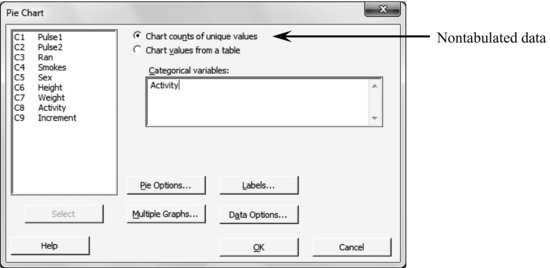
Graph > Pie Chart
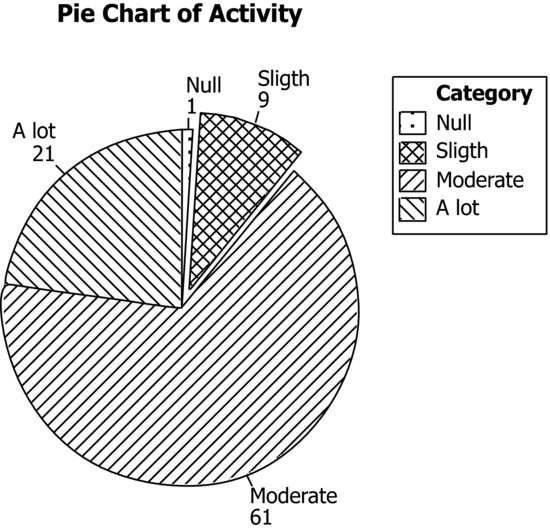
To obtain this appearance we have used fill types instead of colors as done before with the bar charts. Also the options described below have been selected.
To obtain this appearance we have used fill types instead of colors as done before with the bar charts. Also the options described below have been selected.
- Explode or pull away a slice: Edit the slice (click on the graph, click on the slice and double-click on the slice), then click on the Explode tab and finally check the option Explode slice.
- Name and frequency of slices: With the graph as an active window, do: Editor > Add > Slice Labels and check the appropriate options.
- Graph background color and graph borders: Edit the graph, Graph Attributes.
Notice that to edit a part of a graph (a slice of a pie chart, or the points corresponding to a group in a dotplot) it is not enough to click or double-click on that part. The procedure is always the same: 1) Click on the graph; 2) Click on the part to be edited and 3) Double-click on this part.
Get Industrial Statistics with Minitab now with the O’Reilly learning platform.
O’Reilly members experience books, live events, courses curated by job role, and more from O’Reilly and nearly 200 top publishers.

