2.7 Bar Diagrams
Graph > Bar Chart
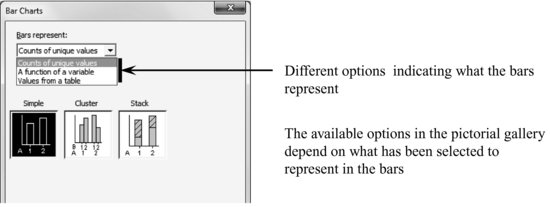
For example: We could represent the number of men and women according to their physical activity level.
Graph > Bar Chart: Counts of Unique Values, Stack
Categorical variables: Activity Sex
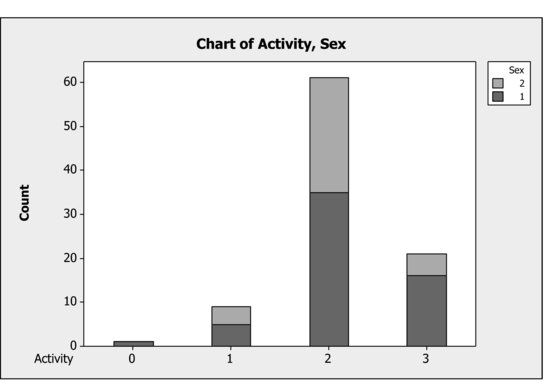
Transform the previous graph that uses the default options, for the next one:
The carried out procedure to change the appearance of the bar chart is:
- Remove the color from the bars: Double-click over any bar to open up a dialog box (headed by Edit bars, tab: Atributes) and in Fill Pattern choose the option Custom and then select the white color in Background color.
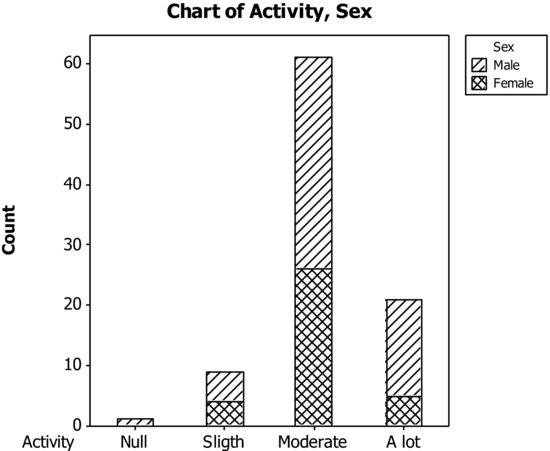
- Use a distinct fill type according to sex. The bars must be active (if not, do so by clicking over any of them). Click over the upper part of a bar (the part corresponding to Sex=2) and then double-click on it. In Fill Pattern, choose the option Custom and in Type select the fill type to use. Repeat the same operation for the bottom part of the bar.
- Assign names to the numeric values used to codify the variables Sex and Activity using the command: Data > Code > Numeric to text. For the variable Sex:
Likewise, the values of the variable activity can be transformed substituting them for their ...
Get Industrial Statistics with Minitab now with the O’Reilly learning platform.
O’Reilly members experience books, live events, courses curated by job role, and more from O’Reilly and nearly 200 top publishers.

