2.5 Dotplots
Graph > Dotplot
Use the available graphical options to: first, compare the pulse rate increments according to the running condition and then do the same but also identifying the points by gender.
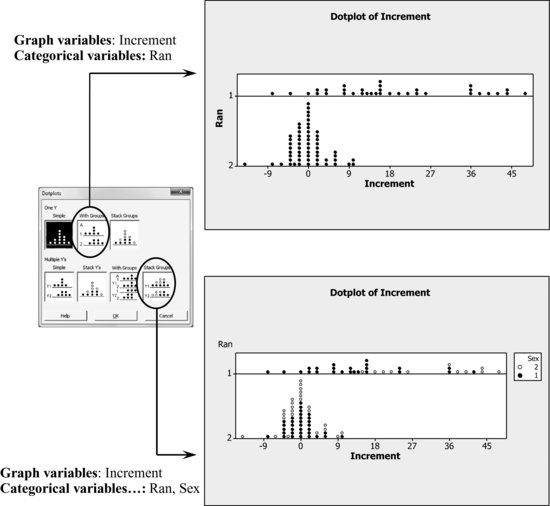
To facilitate the interpretation of the graph when printed without colors, the default type of symbol used for females can be changed (sex=2). The process to carry out such change is: 1) Click over any point; 2) Click over any point of the type that is to be changed; 3) Double-click over the same point 4) Choose the desired type of point in the dialog box that appears.
Get Industrial Statistics with Minitab now with the O’Reilly learning platform.
O’Reilly members experience books, live events, courses curated by job role, and more from O’Reilly and nearly 200 top publishers.

