2.4 Histograms for Various Data Sets
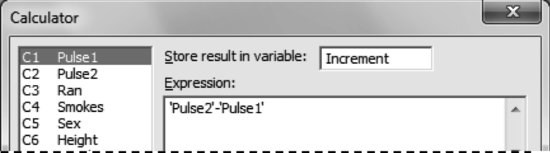
Using the option Calculator located within the Calc menu, we can create the column named ‘Increment’ that defines the difference between the final pulse rate and the initial pulse rate as follow.
Calc > Calculator
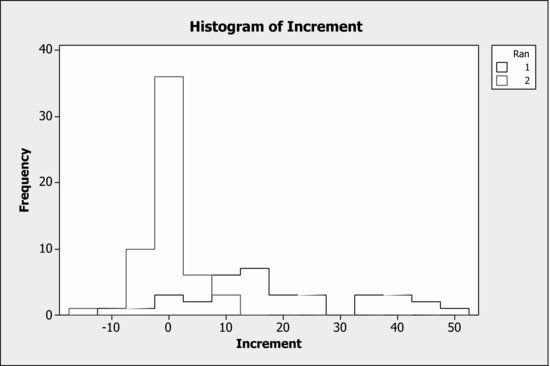
A comparison of pulse increments, depending on whether the student has run or not, can be done through their histograms, as follows.
Graph > Histogram: with Outline and Groups
Putting ‘Increment’ as the variable to represent and ‘ran’ as a categorical variable to form the groups, we obtain (the display shows a different color for each histogram):
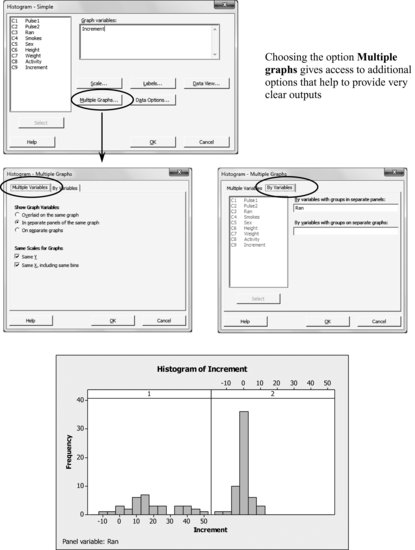
Another option with a more clear result is Graph > Histogram: Simple.
Graph > Histogram: Simple
Get Industrial Statistics with Minitab now with the O’Reilly learning platform.
O’Reilly members experience books, live events, courses curated by job role, and more from O’Reilly and nearly 200 top publishers.

