2.3 Changing the Appearance of Histograms
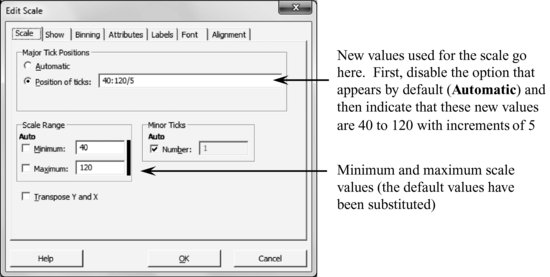
2.3.1 Changes in the Scale of the Horizontal Axis
Double-clicking over any scale value on the horizontal axis, a dialog box pops up. The default values are then changed as follows:
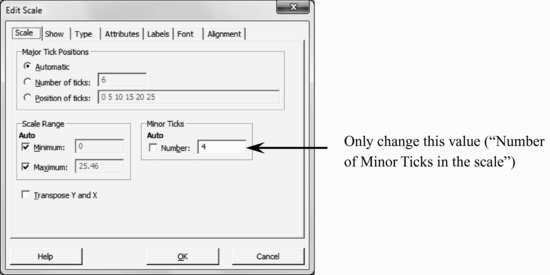
2.3.2 Changes in the Vertical Axis
In this axis the only change with respect to default settings that we make consists in introducing four marks between Y-scale values (these marks are called minor ticks and their use aims to identify values over the scale without indicating the corresponding numbers). To do this:
Double-click over any vertical scale value to display the same dialog box mentioned above:
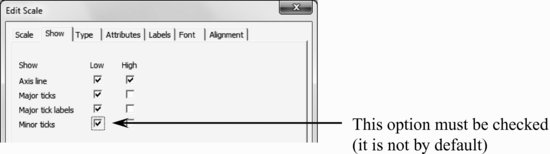
Also go to the tab Show to indicate that the minor ticks must be shown.
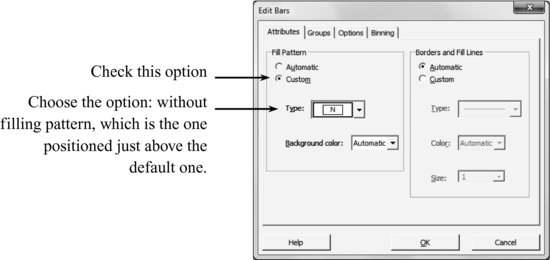
2.3.3 Appearance of the Bars
If, for example, we do not want bars with filling pattern, double-click over any of them. The following window is then displayed:
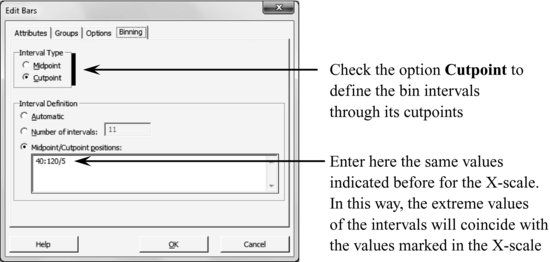
2.3.4 Defining Intervals on which Bars are Located
Double click over any bar and click on the Binning tab.
2.3.5 Appearance of ...
Get Industrial Statistics with Minitab now with the O’Reilly learning platform.
O’Reilly members experience books, live events, courses curated by job role, and more from O’Reilly and nearly 200 top publishers.

