1.1 Initial Screen
Usually, data are arranged in columns: each column represents a variable, and within a column, each row corresponds to an observation. In addition, values may be assigned to constants (K1, K2, …) or matrices (M1, M2, …). However, neither constants nor matrices appear in the worksheet.
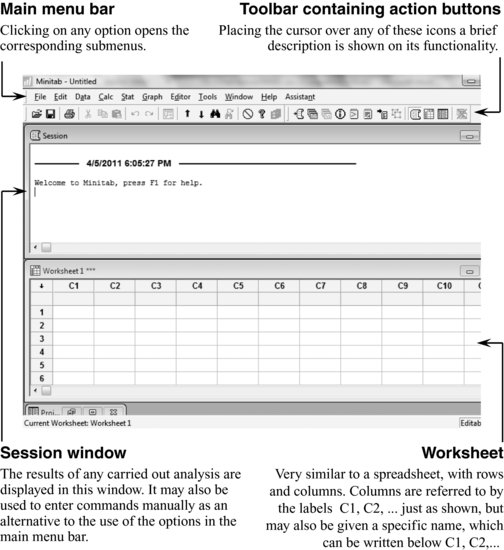
The available submenus depend on which Minitab window is active (Session window, Worksheet, Graph, …). Any window becomes active by just clicking on it.
Get Industrial Statistics with Minitab now with the O’Reilly learning platform.
O’Reilly members experience books, live events, courses curated by job role, and more from O’Reilly and nearly 200 top publishers.

