A2.2 Selection of Data when Plotting a Graph
The same result obtained above can be produced by selecting the data directly, in the same moment that the graph is being created, through the graphic button: Data Options.
Graph > Boxplot > One Y: With Groups
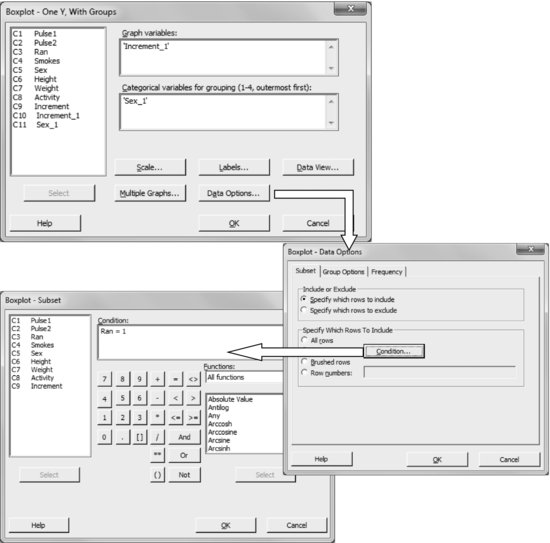
The obtained result is exactly the same as the one obtained before, although the used values do not remain stored separately in the worksheet.
Get Industrial Statistics with Minitab now with the O’Reilly learning platform.
O’Reilly members experience books, live events, courses curated by job role, and more from O’Reilly and nearly 200 top publishers.

