First of all, we need to add a data source. To do this, carry out the following:
- On the displayed Grafana home page, open the side menu by clicking the Grafana icon in the upper-left corner of the top header:
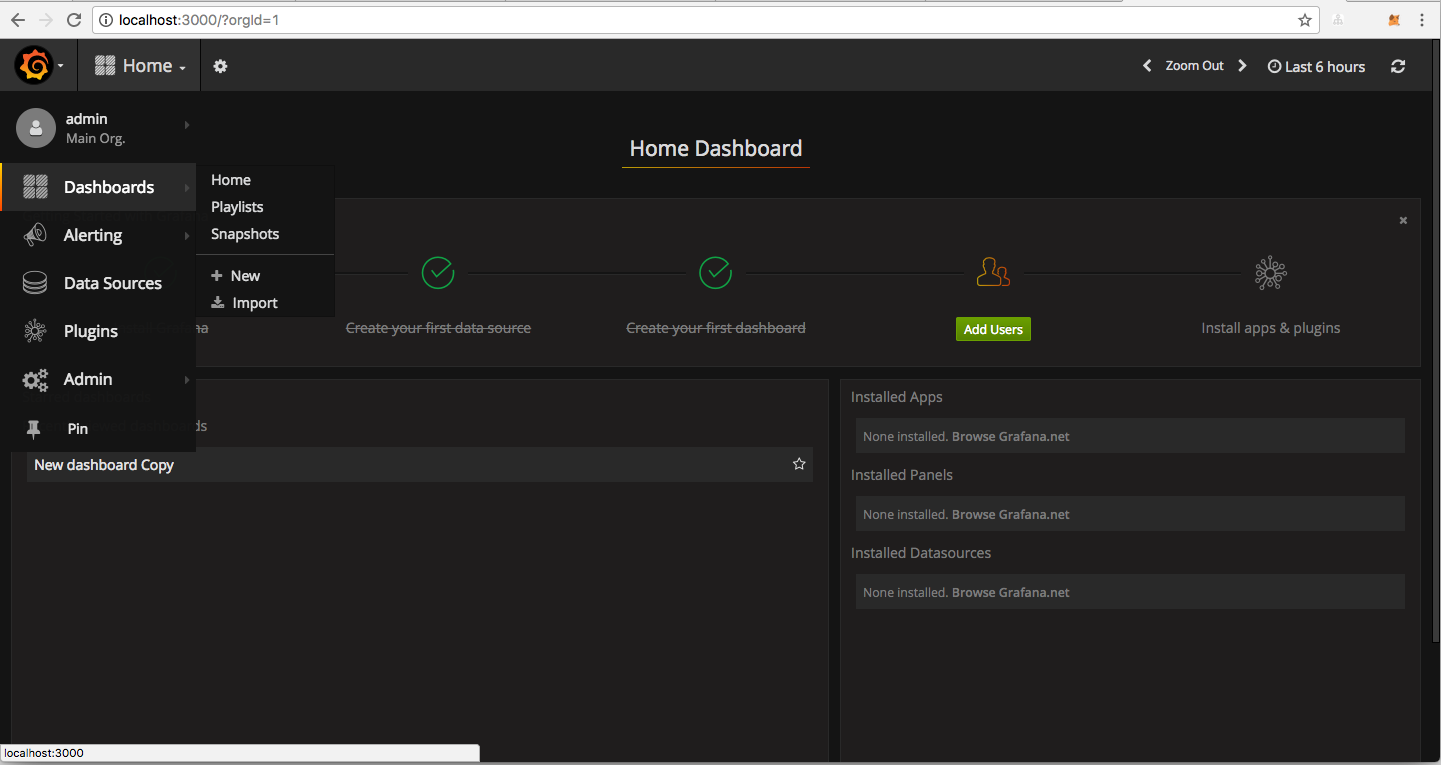
Side menu on the Grafana home page
- On the side menu, click Data Sources.
- Click the + Add data source button in the top header.
- Select InfluxDB from the Type drop-down list. After clicking the Add button, you will see the following window displayed on the screen:
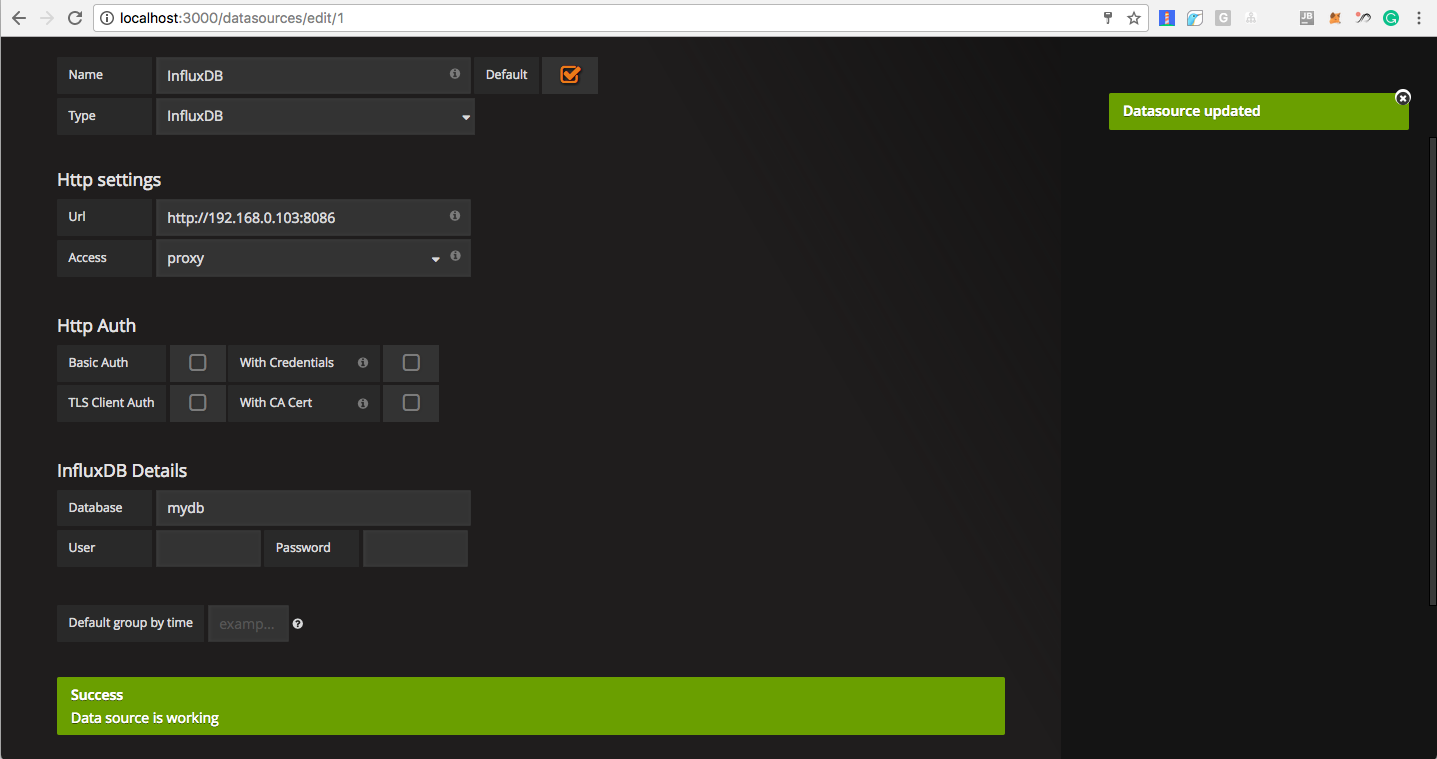
Grafana window after saving a data ...

