Using timechart to show values over time
Timechart lets us show numerical values over time. It is similar to the chart command, except that time is always plotted on the x axis. Here are a couple of things to note:
- The events must have a
_timefield. If you are simply sending the results of a search to the timechart, this will always be true. If you are using interim commands, you will need to be mindful of this requirement. - Time is always bucketed, meaning that there is no way to draw a point per event.
Let's see how many errors have been occurring:
sourcetype="tm1*" error | timechart count
The default chart will look something like this:
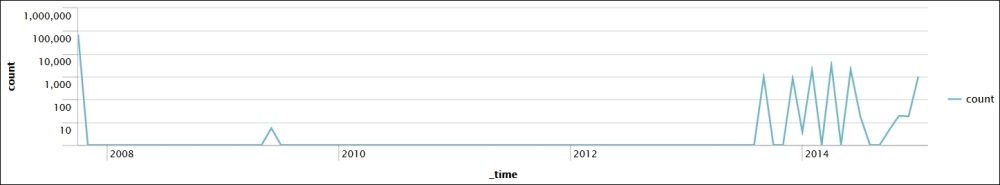
Now let's see ...
Get Implementing Splunk - Second Edition now with the O’Reilly learning platform.
O’Reilly members experience books, live events, courses curated by job role, and more from O’Reilly and nearly 200 top publishers.

