41A Simple Regression Prediction Model
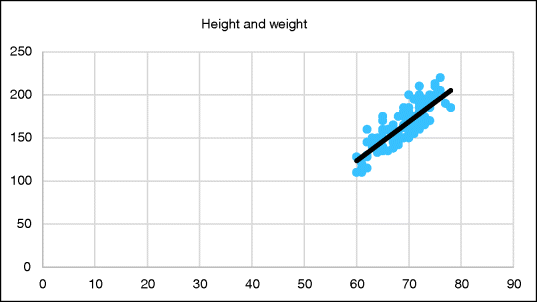
Eyeballing our height and weight scatterplot from before, let's add a line that fits snugly inside the scatterplot data as shown in Figure 41.1. We'll call it a prediction line that predicts peoples' weights based on their heights.

For any value of height (![]() ) we can predict the value of weight (
) we can predict the value of weight (![]() ) using this line. For the average height of 69, the prediction is the average weight of 164 lbs. For 65 inches tall the prediction looks to be about 145 lbs. For 75 inches the prediction looks to be about 190 lbs. For less than 60 inches we probably should not hazard a guess, nor for more than 80 inches: Extrapolating outside the value ranges of our data is usually unwise.
) using this line. For the average height of 69, the prediction is the average weight of 164 lbs. For 65 inches tall the prediction looks to be about 145 lbs. For 75 inches the prediction looks to be about 190 lbs. For less than 60 inches we probably should not hazard a guess, nor for more than 80 inches: Extrapolating outside the value ranges of our data is usually unwise.
Our eyeballed prediction line was placed visually to have the “snuggest fit” to the data. In order to develop a formulaic approach, we need to formally define what “snuggest fit” means. For the formulaic approach we'll be using, the snuggest fitting line is defined as the line with the least sum total of squared differences between the actual ...
Get Illuminating Statistical Analysis Using Scenarios and Simulations now with the O’Reilly learning platform.
O’Reilly members experience books, live events, courses curated by job role, and more from O’Reilly and nearly 200 top publishers.

