10Judging Opinion Splits II
Rather than checking whether a community as a whole might be evenly split, let's figure out how to use our sample proportion statistic and confidence interval to determine what the actual overall community opinion split might actually be.
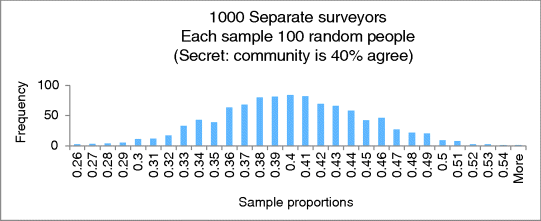
Now, let's say that the proportion of agree for the entire community is actually 0.40. Only omniscient beings know this. We'll use the 0.40 community proportion of agree for a survey sampling simulation. The histogram in Figure 10.1 shows what happened when 1000 independent surveyors each surveyed 100 random community members. The histogram shows the distribution of the 1000 sample proportions.

Based ...
Get Illuminating Statistical Analysis Using Scenarios and Simulations now with the O’Reilly learning platform.
O’Reilly members experience books, live events, courses curated by job role, and more from O’Reilly and nearly 200 top publishers.

