6Variance of Evidence I
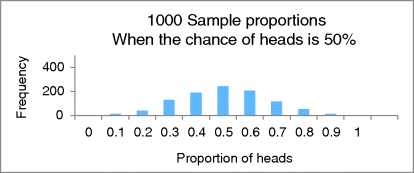
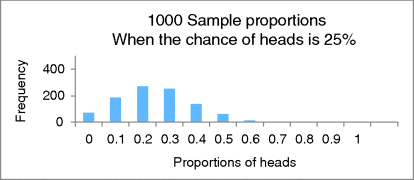
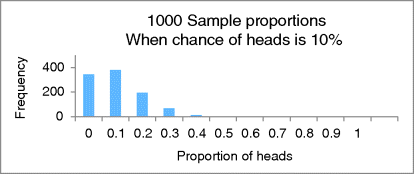
Let's next look at what happens when the coin is unbalanced and the chance of heads is more or less than 50%. As we'll see, a 50% coin will have more outcome variety than a 25% coin that, in turn, will have more outcome variety than a 10% coin. A coin with 0 or 100% chance of heads will have no outcome variety whatsoever. Variety decreases more and more as the chance of heads moves from 50% to 0% or 100% because variety becomes less and less likely. Let's look at three corresponding simulation histograms.
Figure 6.1 shows sample proportions with coins whose chance of heads is 50%.

Figure 6.2 is for coins whose chance of heads is 25%; its outcome variety is less; it is more bunched up.

And Figure 6.3 is for coins whose chance of heads is 10%; its outcome variety is even less; it is even more bunched up (it is also lopsided, which we'll consider in Chapter 9).

For coins whose chance of heads is 0%, all the sample proportions will be equal to 0. There will be no variety of outcomes.
The statistical ...
Get Illuminating Statistical Analysis Using Scenarios and Simulations now with the O’Reilly learning platform.
O’Reilly members experience books, live events, courses curated by job role, and more from O’Reilly and nearly 200 top publishers.

