5Amount of Evidence I
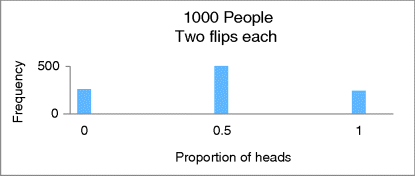
Let's start by considering very small amounts of evidence first: 1000 people flip a fair coin only two times. The possible outcomes are TT, TH, HT, and HH. So, we expect about 250 people to get 0% heads (TT) and about 250 people to get 100% heads (HH), which are both extremely far from the 50% heads (TH, HT) we expect with a fair coin. Next, recall that with 10 flips such extremes are quite infrequent. With 100 flips, then, such extremes should be almost unheard of. Let's look at three corresponding simulation histograms.
When there are only two flips (![]() ), half of the sample proportions are at the extremes of 0 or 1, as shown in Figure 5.1.
), half of the sample proportions are at the extremes of 0 or 1, as shown in Figure 5.1.

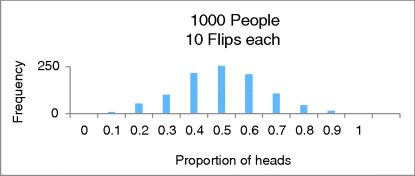
Compared to two flips, when 1000 people flip a fair coin 10 times (![]() ), there are fewer extreme sample proportions, as shown in Figure 5.2.
), there are fewer extreme sample proportions, as shown in Figure 5.2.

And when 1000 people flip a fair coin 100 times (), there are fewer still, as shown in Figure 5.3. The larger the sample size, the less ...
Get Illuminating Statistical Analysis Using Scenarios and Simulations now with the O’Reilly learning platform.
O’Reilly members experience books, live events, courses curated by job role, and more from O’Reilly and nearly 200 top publishers.

